
Fig. 3
- ID
- ZDB-FIG-160914-28
- Publication
- Pantoja et al., 2016 - Neuromodulatory Regulation of Behavioral Individuality in Zebrafish
- Other Figures
- All Figure Page
- Back to All Figure Page
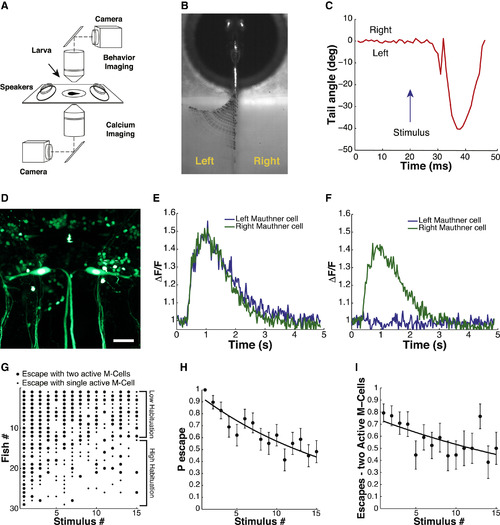
Simultaneous Analysis of Escape Behavior and M-Cell Calcium Signals during ASR Habituation in 6 dpf Zebrafish Larvae (A) Simultaneous behavior (2.5× objective, 1,000 fps) and GCaMP5 calcium imaging of M-cells (40× objective, 40 fps) with two independent light paths. (B) Representative image of time-series projection (ventral view) of sound-induced escape behavior. (C) Tracking of tail movement during response to acoustic stimulus at t = 20 ms. (D) Representative image (dorsal view) of tg(s1181t:Gal4;UAS:kaede) transgenic zebrafish line. Scale bar, 25 µm. (E and F) GCaMP5 calcium activity traces from M-cells in response to acoustic stimulus at 400 ms. (G) Acoustic startle responses of individual larvae ordered along y axis by probability of escape over the stimulus series. Each dot represents a sound-induced escape event: large dot represents escape with two M-cells active; small dot represents escape with one M-cell active. (H) Decrease in ASR probability during stimulus series (F-statistic versus constant model: 41.5, p < 10-9, adjusted R-squared = 0.085). (I) ASR habituation accompanied by significant decrease in the fraction of escapes with two active M-cells (F-statistic versus constant model: 9.15, p < 0.01, adjusted R-squared = 0.028). Statistics: linear regression model analysis. Nlarvae = 29. Error bars, SEM. |