
Fig. 3
- ID
- ZDB-FIG-160901-3
- Publication
- Casano et al., 2016 - Developmental Apoptosis Mediates Entry and Positioning of Microglia in the Zebrafish Brain
- Other Figures
- All Figure Page
- Back to All Figure Page
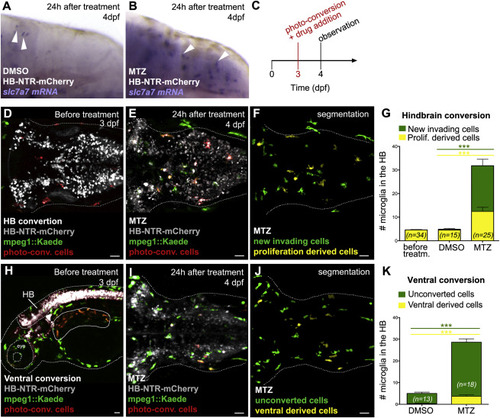
Neuronal Apoptosis Promotes Microglial Brain Colonization by Attracting Macrophages into the Brain (A and B) Whole mount in situ hybridization (WISH) images show slc7a7 expression (white arrowheads) in HB-NTR-mCherry transgenic embryos 24 hr after DMSO (A) or MTZ (B) treatment. (C) Experimental setup. At 3 dpf, Kaede+ cells are photo-converted in the hindbrain or ventral region of NTR-mCherry+ embryos and soon after samples are treated with DMSO or MTZ. Then 24 hr later green and red/yellow cells are quantified in the hindbrain. (D and E) Hindbrain dorsal views of a 3-dpf mpeg1::GAL4-UAS::Kaede;HB-NTR-mCherry embryo, after microglia photo-conversion and prior to drug treatment (D) and 24 hr after photo-conversion and MTZ treatment (E). New invading microglia are in green and microglia derived from converted cells are in red/yellow. (F and J) Segmented images of (E) and (I), respectively. NTR-mCherry+ neurons are omitted. (G) Quantification of hindbrain microglia after induction of apoptosis. Histogram on the left refers to the number of photo-converted microglia populating the hindbrain prior to MTZ incubation; histograms on the right represent the number of newly arrived microglia (green bars) and those resulting from local proliferation (yellow bars) 24 hr after photo-conversion and DMSO or MTZ treatment. Data are from three independent experiments. (H) Lateral view shows a 3-dpf mpeg1::GAL4-UAS::Kaede;HB-NTR-mCherry embryo, after photo-conversion of Kaede+ macrophages in the ventral region (red cells, solid line) and before MTZ treatment. (I) Hindbrain dorsal view of an mpeg1::GAL4-UAS::Kaede;HB-NTR-mCherry embryo, 24 hr after ventral photo-conversion and MTZ treatment. Invading cells deriving from the ventral region are in red/yellow. (K) Number of hindbrain microglia in mpeg1::GAL4-UAS::Kaede;HB-NTR-mCherry embryos, 24 hr after ventral photo-conversion and drug treatment. Data are from three independent experiments. HB, hindbrain; n, number of embryos; NS, non-significant; ***p < 0.001. NTR-mCherry+ neurons are in gray. Dotted line marks the hindbrain area or the embryo outline. Scale bar represents 30 µm. |
| Genes: | |
|---|---|
| Fish: | |
| Condition: | |
| Anatomical Terms: | |
| Stage Range: | Protruding-mouth to Day 4 |
| Fish: | |
|---|---|
| Condition: | |
| Observed In: | |
| Stage: | Day 4 |