
Fig. S3
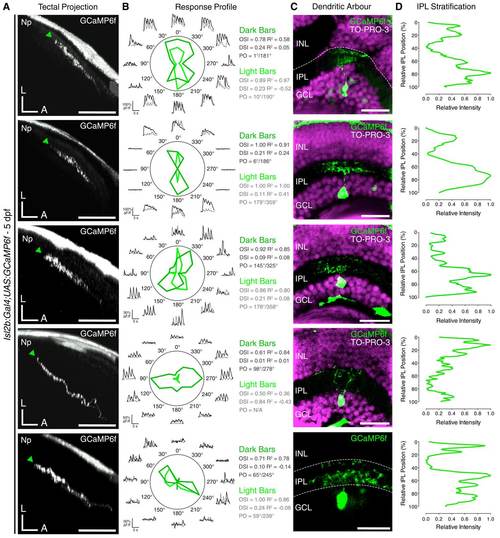
IPL Dendritic Stratification Pattern of Individual OSGCs, Related to Figure 2. (A) Side views of axon projections (green arrowheads) of individual OSGCs expressing GCaMP6f in the optic tectum of 5-dpf UAS:GCaMP6f-injected Tg(isl2b:Gal4) larvae. 12.8% of functionally imaged RGCs were OS (5 out of 39 cells in 39 larvae). Np, neuropil; A, anterior; L, lateral. Scale bars are 40 µm. (B) Functional identification of individual OSGCs through analyses of their visual responses to moving bars. Polar plots represent the tuning profiles (obtained by calculating the integral response to each stimulus) of OSGCs for dark and light moving bars (dark and light green, respectively). Black and grey traces represent the ΔF/F0 calcium responses to moving dark and light bars, respectively. OSI, orientation selectivity index; DSI, direction selectivity index; R2, Gaussian goodness of fit; PO, preferred orientation. (C and D) Immunostaining for GCaMP6f (green) showing the dendritic morphology of functionally identified OSGCs (C) and corresponding normalised IPL fluorescence intensity profiles (D). 0% corresponds to the INL/IPL boundary, whereas 100% corresponds to the IPL/GCL boundary. Cell bodies are labelled with the nuclear stain TO-PRO-3 (magenta). INL, inner nuclear layer; GCL, ganglion cell layer; IPL, inner plexiform layer. Scale bars are 20 µm. |