
Fig. S2
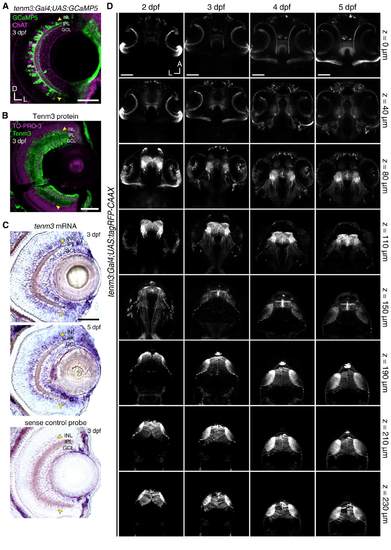
Tg(tenm3:Gal4) BAC Transgenic Labelling in the Retina and Brain, Related to Figure 2 and Movie S2. (A) Immunostaining showing tenm3 BAC transgenic labelling of a subset of amacrine cells in a 3- dpf Tg(tenm3:Gal4;UAS:GCaMP5G) larva. GCaMP5 expression is showed in green, whereas choline acetyltransferase (ChAT) expression is showed in magenta as a reference. Yellow arrowheads indicate tenm3+ amacrine cells in the inner portion of the inner nuclear layer (INL). GCL, ganglion cell layer; IPL, inner plexiform layer. D, dorsal; L, lateral. Scale bar is 40 µm. (B) Immunostaining showing the expression of Tenm3 (green) in the retina of a 3-dpf WT larva. Cell bodies are labelled with the nuclear stain TO-PRO-3 (magenta). Yellow arrowheads indicate Tenm3+ amacrine cells in the inner portion of the INL. Scale bar is 40 µm. (C) In situ hybridisations showing tenm3 mRNA expression in the retinae of 3- and 5-dpf WT larvae (top). A control in situ hybridisation at 3 dpf using sense tenm3 riboprobe is reported at the bottom. Yellow arrowheads indicate the inner portion of the INL. Scale bar is 40 µm. From Antinucci, et al. [S1]. (D) Overview of the brain regions labelled by the Tg(tenm3:Gal4;UAS:tagRFP-CAAX) BAC transgenic zebrafish line from 2 to 5 dpf. Eight Z-planes are displayed per developmental stage (approximately 230 µm total volume thickness). The most ventral regions (z = 0 µm) are displayed at the top, whereas the most dorsal ones (z = 230 µm) are at the bottom. Note that tagRFP-CAAX is expressed in the retina (0-80 µm Z-axis depth), thalamus (80-150 µm Z-axis depth), and optic tectum (150-230 µm Z-axis depth), which are brain regions where tenm3 is highly expressed. A, anterior; L, left. Scale bars are 100 µm. |