
Fig. 1
- ID
- ZDB-FIG-160817-12
- Publication
- Hatzold et al., 2016 - Tumor suppression in basal keratinocytes via dual non-cell-autonomous functions of a Na,K-ATPase beta subunit
- Other Figures
- All Figure Page
- Back to All Figure Page
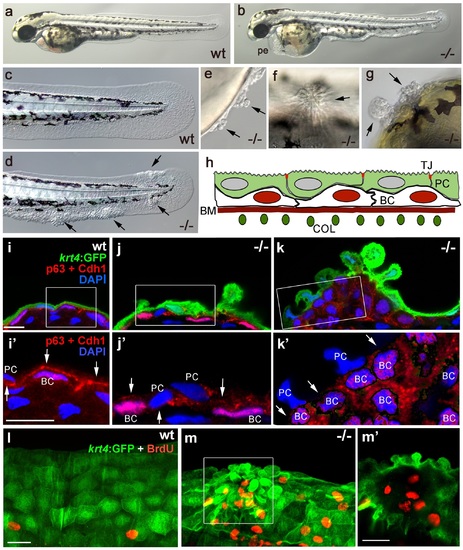
Epidermal aggregates in psoriasis mutants display hyperplasia. (a-g) Live images of wt siblings (a,c) and psoriasis mutants (b,d-g); psoriasis mutants develop pericardial edema (pe) and epidermal aggregates on the medium fin fold (b, d), on the yolk sac (e), on the flank (f) (all at 54 hpf), and on the head (g; 72 hpf). (h) Schematic of embryonic skin. Peridermal cells (PC, green) with apical tight junctions (TJ, red) are located above p63 basal keratinocytes (BC, red nuclei). The basement membrane (BM, red) separates the basal epidermal layer from the dermis containing collagen fibers (COL, green). (i-k) IF of periderm-specific GFP (green), Cdh1 (red), and p63 (red) on transverse sections through 48 hpf Tg(krt4:GFP) wt and psoriasis mutant embryos, counterstained with DAPI (blue). (i′-k′) show magnified views of regions framed in (i-k), without the green channel. In wt, the epidermis is bi-layered, with flat cells (i) and Cdh1 is localized at cell borders between peridermal and basal cells (i′; arrows). In an early-stage aggregate of the mutant, peridermal cells have rounded up (j), and Cdh1 levels are reduced at cell borders (j′,k′; arrows). An advanced aggregate (k) contains multi-layered basal epidermal cells (k′). Scale bar: 10 µm. (l,m) Whole mount IF of incorporated BrdU (red) and periderm-specific GFP (green) in 54 hpf Tg(krt4:GFP) wt sibling (l) and psoriasis mutant (m), showing elevated numbers of BrdU-positive non-peridermal cells in aggregates. (m) Maximum intensity projection of a confocal Z stack through aggregate; (m′) single focal plane. Scale bars: 20 µm. Abbreviations: BC, basal cell; BM, basement membrane; COL, collagen fibers; PC, peridermal cell; pe, pericardial edema; wt, wild-type. |
| Genes: | |
|---|---|
| Antibody: | |
| Fish: | |
| Anatomical Terms: | |
| Stage: | Long-pec |
| Fish: | |
|---|---|
| Observed In: | |
| Stage Range: | Long-pec to Protruding-mouth |