
Fig. 5
- ID
- ZDB-FIG-160524-38
- Publication
- Hackett et al., 2016 - Chemical Biology in the Embryo: In Situ Imaging of Sulfur Biochemistry in Normal and Proteoglycan-Deficient Cartilage Matrix
- Other Figures
- All Figure Page
- Back to All Figure Page
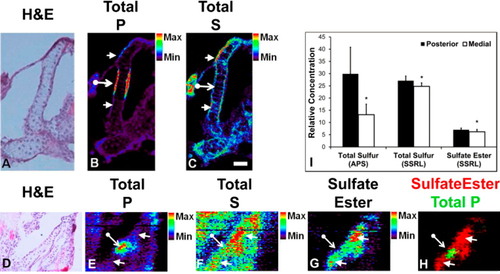
Phosphorus, sulfur, and sulfate ester distributions show significant variations during cartilage development. As development progresses, bone begins to form along the edge of cartilage, beginning in the middle segment. (A) H&E histology of the cartilage imaged with XFI at the APS in panels B and C. (B) Total phosphorus (P) distribution highlighting a high P level in the middle of the cartilage element (long arrow) and a low P level at the posterior and anterior ends (short arrowheads). (C) Total sulfur (S) distribution showing low S in the middle of the cartilage element (arrow) and a high S level at the posterior and anterior ends (arrowheads). (D) H&E histology of the cartilage element imaged with chemically specific XFI at SSRL (E-H). (E) Total P image from chemically specific XFI highlighting the high P level in the middle of the cartilage element (arrow) and the low P level at the posterior and anterior ends (arrowheads). (F) Total S distribution showing the low S level in the middle of the cartilage element (arrow) and the high S level at the posterior and anterior ends (arrowheads). (G) Chemically specific XFI sulfate ester distribution showing the low sulfate ester content in the middle of the cartilage element (arrow) and the high sulfate ester content at the posterior and anterior ends (arrowheads). (H) Overlap of the P (green) and sulfate ester (red) distribution. (I) Quantitative analysis of the total S and sulfate ester content of posterior and medial cartilage regions. Total sulfur was measured at two different synchrotron facilities, the Advanced Photon Source (APS) and the Stanford Synchrotron Radiation Lightsource (SSRL), and the same scientific conclusion was reached in each case. The data are presented as the relative concentration (fluorescence yield). A Student’s t test at the 95% confidence limit was used to test for the significant difference between groups. *p < 0.05. The scale bar is 10 µm. |