
FIGURE
Fig. S4
- ID
- ZDB-FIG-160412-2
- Publication
- Gao et al., 2016 - GATA Factor-G-Protein-Coupled Receptor Circuit Suppresses Hematopoiesis
- Other Figures
- All Figure Page
- Back to All Figure Page
Fig. S4
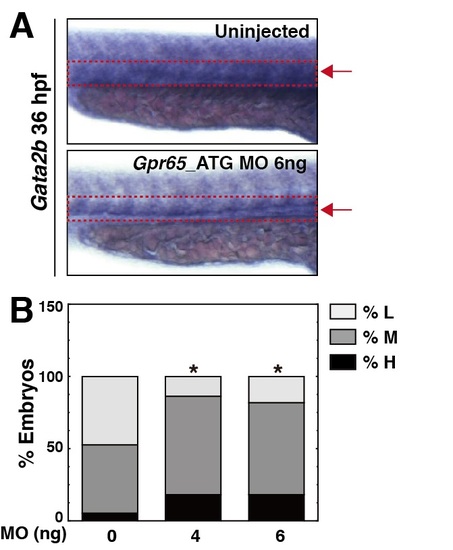
Related to Figure 5: GPR65 suppresses Gata2 expression in the zebrafish embryo. (A) Representative images of in situ hybridization for Gata2 at 36 hours post fertilization. The red rectangle illustrates the region enriched in hemogenic endothelium. (B) Quantitative analysis of in situ hybridization data expressed as percentage of embryos with high, medium, and low Gata2 staining in total embryos (ATG_MO 0ng [n=104 embryos]; ATG_MO 4ng [n=22 embryos]; ATG_MO 6ng [n=40 embryos]). Error bars represent SEM. *, P < 0.05 (two-tailed unpaired Student’s t-test). |
Expression Data
| Gene: | |
|---|---|
| Fish: | |
| Knockdown Reagent: | |
| Anatomical Term: | |
| Stage: | Prim-25 |
Expression Detail
Antibody Labeling
Phenotype Data
| Fish: | |
|---|---|
| Knockdown Reagent: | |
| Observed In: | |
| Stage: | Prim-25 |
Phenotype Detail
Acknowledgments
This image is the copyrighted work of the attributed author or publisher, and
ZFIN has permission only to display this image to its users.
Additional permissions should be obtained from the applicable author or publisher of the image.
Full text @ Stem Cell Reports