
Fig. 2
- ID
- ZDB-FIG-160401-1
- Publication
- Faure et al., 2016 - A workflow to process 3D+time microscopy images of developing organisms and reconstruct their cell lineage
- Other Figures
- All Figure Page
- Back to All Figure Page
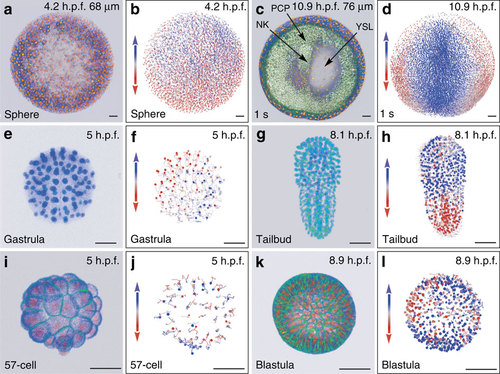
Reconstructing early embryogenesis from time-lapse optical sectioning. (a-d) Danio rerio data set Dr1, animal pole (AP) view; (a,b) sphere stage, volume cut at 68 µm of the AP to visualize deep cells; (c,d) 1-somite stage (1 s), volume cut at 76 µm of the AP; NK, neural keel; PCP, prechordal plate; YSL, yolk syncytial layer. (e-h) Phallusia mammillata data set Pm1, vegetal view, circum notochord side up; (e,f) gastrula stage; (g,h) tailbud stage. (i-l) Paracentrotus lividus data set Pl1, lateral view, AP up; (i,j) 57-cell stage; (k,l) blastula stage. (a,c,e,g,i,k) 3D raw data visualization (with Amira software), hours post fertilization (h.p.f.) indicated top right, developmental stage indicated bottom left, scale bars, 50 µm. (a,c,i,k) Nuclear staining from H2B-mCherry mRNA injection (in orange), membrane staining from eGFP-HRAS mRNA injection (in green). (e,g) Nuclear staining from H2B-eGFP mRNA injection (in blue-green). (b,d,f,h,j,l) Reconstructed embryo visualized with the Mov-IT tool, corresponding to (a,c,e,g,i,k), respectively. Each cell is represented by a dot with a vector showing its path over the next time steps (15 for the zebrafish data, 9 for the ascidian and sea urchin data). Colour code indicates cell displacement orientation. |