
FIGURE
Fig. S3
Fig. S3
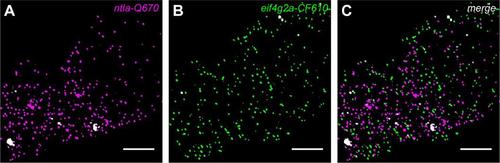
Dual color detection of ntla and eif4g2a by smFISH does not display overlap. Dual color detection of transcripts for ntla (A) and eif4g2a (B) in a single z-slice of Fig. 1B. (C) Merged image of the detections in (A) and (B). Transcript detection of the two probe sets does not overlap, indicating the specificity of our smFISH protocol. Scale bars: 10 µm. |
Expression Data
Expression Detail
Antibody Labeling
Phenotype Data
Phenotype Detail
Acknowledgments
This image is the copyrighted work of the attributed author or publisher, and
ZFIN has permission only to display this image to its users.
Additional permissions should be obtained from the applicable author or publisher of the image.
Full text @ Development