
FIGURE
Fig. S1
Fig. S1
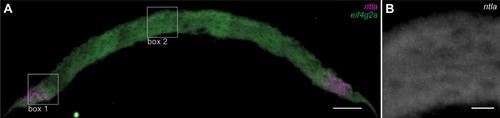
smFISH for ntla and eif4g2a at 50% epiboly. (A) smFISH for ntla and eif4g2a on a cross-section of an embryo at 50% epiboly showing the complete view of the animal cap shown in Fig. 1A. ntla is expressed in the margin. eif4g2a is ubiquitously expressed. Box 1: region depicted in Figs 1B-D. Box 2: region depicted in Fig. S2B. Scale bar: 50 µm. (B) Detail of (A) showing the absence of ntla transcripts at the animal pole. Scale bar: 10 µm. Images are maximum projections of 17 z-slices spaced by 0.3 µm. |
Expression Data
Expression Detail
Antibody Labeling
Phenotype Data
Phenotype Detail
Acknowledgments
This image is the copyrighted work of the attributed author or publisher, and
ZFIN has permission only to display this image to its users.
Additional permissions should be obtained from the applicable author or publisher of the image.
Full text @ Development