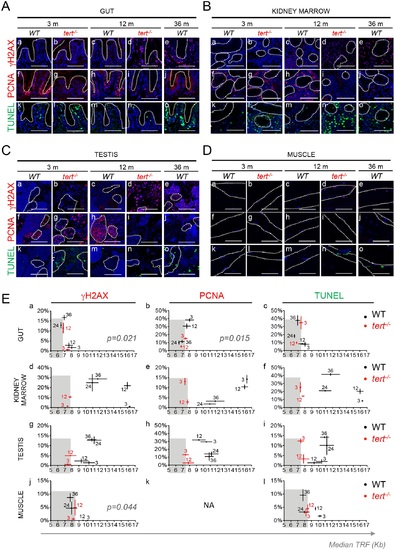
Shortening of mTL anticipates accumulation of DDR markers, decrease in cell proliferation and increase in apoptotis with age. A-D) Representative immunofluorescence images of DNA damage (γH2AX), proliferation (PCNA) and apoptosis (TUNEL) for gut (A—dashed outline identifies the villi), kidney marrow (B), testis (C) and muscle (D—dashed outline identifies the fibers) of WT (at 3, 12 and 36 months) and tert-/- mutant siblings (at 3 and 12 months). All tissues show a significant increase in cells bearing five or more γH2AX foci by 12 months of age in tert-/- zebrafish (panels b, d) and by 36 months in WT zebrafish (panels a, c and e). Increased DNA Damage Response (DDR) correlates with shorter mTL in Ea) Gut (p = 0.021) and Ej) Muscle (p = 0.044) but not Ed) Kidney Marrow or Eg) Testis. Grey shaded area identifies the median telomeric length at which significant DDR activation is observed in tert-/- mutants (Ea, Ed, Eg, Ej). Proliferative tissues, A) gut B) kidney marrow and C) testis, show a sustained decrease in cell proliferation by 12 months of age in tert-/- (panels g, i) and by 36 months in WT tissues (panels f, h and j). Eb) Decrease in proliferation correlates with shorter mTL in the gut (p = 0.015). Grey shaded area identifies the median telomeric length at which significant proliferation defects are observed in tert-/- mutants (Eb, Ee, Eh). tert-/- mutants’ A) gut B) kidney marrow and C) testis show increased apoptotic responses at 3 months when compared with WT controls (panel l). WT zebrafish show a continuous accumulation of apoptotic signals with age (panels k, m, o). Apoptotic responses are not anticipated by shorter mTL (Ec, Ef, Ei, El). Grey shaded area identifies the median telomeric length at which significant apoptotic responses are observed in tert-/- mutants (Ec, Ef, Ei, El). Most DDRs and apoptotic signals locate to the proliferative zone of maturing spermatocytes (C—dashed outline). WT and tert-/- age groups are indicated in each graph by black and red colored numbers, respectively. Immunofluorescence (IF) quantifications were performed in at least 3 different fields of view for 3–5 different individuals per time point per genotype. Gut IF quantifications were calculated as number of positive cells per “crypt” zone. Other tissues′ IF was quantified as overall % positive cells. Scale bar = 50 µm. N = 3–6 for tissue mTL quantifications per genotype per time point (x-axis in graphs of Fig 3E). IF and mTL quantifications are represented as mean +/- SEM.
|
