
Fig. 3
- ID
- ZDB-FIG-160225-47
- Publication
- Bettini et al., 2016 - Histopathological analysis of the olfactory epithelium of zebrafish (Danio rerio) exposed to sublethal doses of urea
- Other Figures
- All Figure Page
- Back to All Figure Page
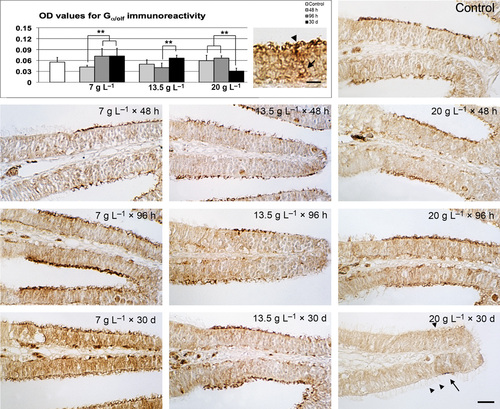
Gα olf immunohistochemistry. (A) Densitometric analysis and comparison between controls and treatments. (B) Detail of control epithelium at high magnification; arrow: labelled cell body in the basal layer; arrowhead: Gα olf-positive olfactory knob. Scale bar: 10 µm. (C) Representative micrograph of control tissue. (D1–3) Representative micrographs of lamellae exposed to 7 g L-1 of urea. (E1–3) Representative micrographs of lamellae exposed to 13.5 g L-1 of urea. (F1–3) Representative micrographs of lamellae exposed to 20 g L-1 of urea. Arrowheads: ciliated non-sensory cells; arrow: Gα olf-positive cells. Significant differences are indicated by asterisks: **P < 0.01. Scale bar: 20 µm. OD, optical density. |