
Fig. 1
- ID
- ZDB-FIG-160225-18
- Publication
- Fidelin et al., 2015 - State-Dependent Modulation of Locomotion by GABAergic Spinal Sensory Neurons
- Other Figures
- All Figure Page
- Back to All Figure Page
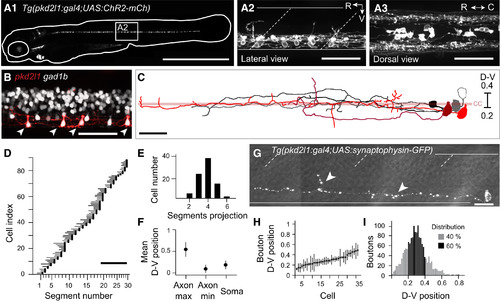
The Tg(pkd2l1:gal4)icm10 Stable Transgenic Line Specifically Labels CSF-cNs in the Zebrafish Spinal Cord (A1) Complete pattern of expression of mCherry in Tg(pkd2l1:gal4;UAS:ChR2-mCh) double transgenic larvae at 4 dpf. (A2) Lateral view of the spinal cord shows that mCherry was restricted to CSF-cNs in the ventral part of the spinal cord. Seven CSF-cNs were labeled per axial segment on average. (A3) Dorsal view of the spinal cord shows that axonal projections of CSF-cNs were ipsilateral and located in the lateral margins of the spinal cord. See also Figure S1 and Table S1. (B) Overlap of mCherry (red) and GFP (gray) in the Tg(pkd2l1:gal4;UAS:ChR2-mCh;Gad1b:GFP) triple transgenic larvae confirms the GABAergic nature of CSF-cNs (arrowheads). Note that the Tg(pkd2l1:gal4) line does not label all CSF-cNs. (C) Morphology of five CSF-cNs located in segment 9 at 3 dpf after single-cell imaging and reconstruction. Axonal projections varied in length, in branching as well as in dorsoventral (D-V) positioning. Cells were aligned according to the D-V position of their cell body. The central canal (cc) is represented by the light red bar. (D) Mapping of CSF-cNs axonal projections across the rostrocaudal (R-C) axis. All CSF-cNs had ascending projections reaching from two to six segments away from the cell body (black circles, n = 88 cells). (E) Distribution of the number of segments covered by single axons of CSF-cNs. (F) Mean D-V positions of axons (maxima and minima) and soma of CSF-cNs. (G) Single Synaptophysin-GFP CSF-cN with punctate synaptophysin clustering consistent with presynaptic boutons distributed along the entire axonal arborization (arrowheads). See also Movie S1. (H) D-V position of putative synaptic boutons for CSF-cNs sorted according to their soma position along the D-V axis (n = 36 cells). (I) Distribution of putative synaptic boutons along the D-V axis (black bars indicate that 60% of the boutons are confined in the 0.2–0.4 interval). In (A2) and (G), white solid lines delineate the ventral and dorsal limits of the spinal cord; dashed lines indicate the limits of axial segments. Scale bars are 1 mm in (A1), 50 µm in (A2), (A3), and (B), 900 µm in (D), and 20 µm in (C) and (G). R, rostral; C, caudal; V, ventral; CC, central canal. (A)–(B) were reconstructed from Z projection stacks through the entire spinal cord. Data are represented here as mean ± SD. |
| Genes: | |
|---|---|
| Fish: | |
| Anatomical Terms: | |
| Stage: | Day 4 |