
FIGURE
Fig. 7 S1
- ID
- ZDB-FIG-160215-32
- Publication
- Yokota et al., 2015 - Endothelial Ca(2+) oscillations reflect VEGFR signaling-regulated angiogenic capacity in vivo
- Other Figures
- All Figure Page
- Back to All Figure Page
Fig. 7 S1
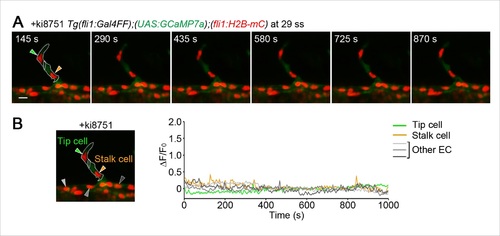
Ca2+ responses after stalk cell budding from the DA are dependent upon Vegfr. (A) 3D-rendered time-sequential images of Tg(fli1:Gal4FF);(UAS:GCaMP7a);(fli1:H2B-mC) embryos treated with ki8751 after stalk cells completely migrate out of the DA as in Figure 7A. The embryos were treated from 28 ss with ki8751 and time-lapse imaged at 29 ss. Green and orange arrowheads indicate tip and stalk cells, respectively. (B) The fluorescence changes in GCaMP7a (ΔF/F0) of individual ECs from A indicated by arrowheads at the left panel are shown as a graph. Scale bar, 10 µm in A. |
Expression Data
Expression Detail
Antibody Labeling
Phenotype Data
Phenotype Detail
Acknowledgments
This image is the copyrighted work of the attributed author or publisher, and
ZFIN has permission only to display this image to its users.
Additional permissions should be obtained from the applicable author or publisher of the image.
Full text @ Elife