
Fig. S4
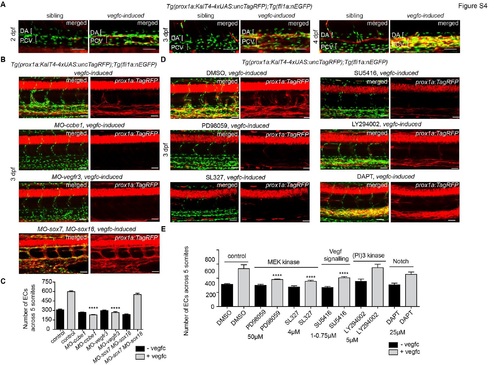
Vegfc-signalling through Vegfr3/Mek/Erk is sufficient to induce VEC proliferation and prox1a expression (A) Maximum intensity projections of Tg(fli1a:nEGFP) in green and prox1a:TagRFP in red in sibling (left panel, n=12) and vegfc-induced (right panel, n=13) embryos at 2, 3 and 4 dpf (scale bars=50µm). At all stages induction of Vegfc results in expansion of VEC number and ectopic prox1a expression in venous endothelial cells (PCV=posterior cardinal vein) but not in arterial endothelial cells (DA=dorsal aorta). (B) Maximum intensity projections of Tg(fli1a:nEGFP) in green and prox1a:TagRFP in red, with Tg(10xUAS:vegfc) of vegfc-induced uninjected embryos, vegfc-induced;MO-ccbe1 injected embryos, vegfc-induced;MO-vegfr3 injected embryos and vegfc-induced;MOsox7; MO-sox18 injected embryos at 3 dpf (for n-values see Table S1, scale bars=40µm). (C) Quantification of EC number in: control (n=12 embryo projections analysed); vegfc-induced (n=34); MO-ccbe1 (n=6); vegfc-induced, MO-ccbe1 (n=24); MO-vegfr3 (n=11), vegfc-induced, MO-vegfr3 (n=16); MO-sox7, MO-sox18 (n=11); and vegfc-induced, MOsox7, MO-sox18 embryos (n=25) (mean ± SEM, ANOVA ****p<0.0001). (D) Maximum intensity projections of Tg(fli1a:nEGFP) in green and prox1a:TagRFP in red, with Tg(10xUAS:vegfc) of vegfc-induced DMSO treated controls, vegfc-induced PD98059 treated, vegfc-induced SL327 (Mek inhibitor) treated, vegfc-induced SU5416 treated (Vegfr inhibitor), vegfc-induced LY294002 treated (PI3K inhibitor) and vegfc-induced DAPT treated (γ-secretase/Notch signalling inhibitor) embryos (for n-values see Table S1, scale bars=40µm). (E) Quantification of EC number in: DMSO (n=6 embryo projections analysed); vegfc-induced DMSO (n=10); PD98059 (Mek inhibitor) (n=5); vegfc-induced PD98059 (n=17); SL327 (Mek inhibitor) (n=4); vegfc-induced SL327 (n=11); SU5416 (Vegfr inhibitor) (n=8); vegfc-induced SU5416 (n=20); LY294002 (Pi3K inhibitor) (n=7); vegfc-induced LY294002 (n=6); DAPT (γ-secretase/Notch signalling inhibitor) (n=7); and vegfc-induced DAPT (n=7), The significance was calculated by comparing the treated samples to DMSO control and treated vegfc-induced to DMSO vegfc-induced control (mean ± SEM, ANOVA ****p<0.0001). |