
Fig. 3
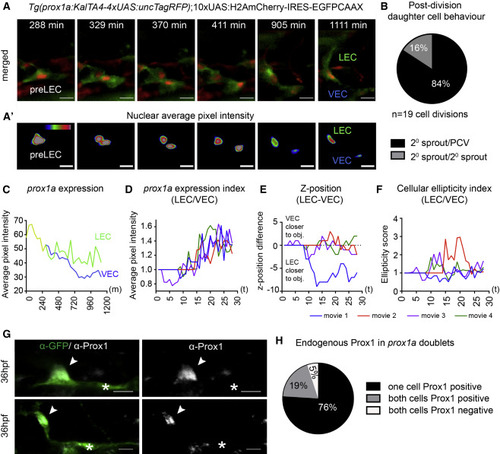
Bipotential prox1a-Positive Precursors in the PCV Give Rise to LECs and VECs (A) Maximum intensity projections from time lapse of cell division in a prox1a-positive pre-LEC Tg(prox1a:TagRFP) labeled with 10xUAS:H2AmCherry-IRES-GFPCAAX. Nuclei are red and membranes are green. Scale bars, 15 µm. (A′) Heatmap of average fluorescent intensity of prox1a:H2AmCherry nuclei depicted in (A) (scale bars, 15 µm). (B) Percentage daughter cell behaviors observed post-/pre-LEC division (84%, one cell migrating dorsally [2° sprout] and one remaining in the PCV; 16%, both daughter cells migrate dorsally; and 0%, both daughter cells remaining the PCV [n = 19 cell divisions]). (C) Average nuclear prox1a:H2AmCherry fluorescent intensity per pixel over time for movies shown in (A) and (A′), prior to division (yellow), LEC (green), and VEC (blue). (D) Index of LEC/VEC prox1a:H2AmCherry average nuclear fluorescent intensity per pixel over time taken from n = 4 independent time-lapse movies. Each color represents an independent division event (movie 1, blue; movie 2, red; movie 3, purple; and movie 4, green). (E) Difference in z-position of the LEC versus the VEC nucleus over time in corresponding time-lapse movies shown in (D). (F) Index of LEC/VEC nuclear ellipticity (longest axis/shortest axis) over time of corresponding time-lapse movies in (D). (G) Endogenous Prox1 (gray) in prox1a:Venus doublets (two cells side by side in isolation in the PCV [green]) at 36 hpf (a Prox1-positive cell [arrowhead]/Prox1-negative cell [asterisk], n = 18; upper and lower are two different examples. Scale bars, 15 µm. (H) Percentage of different Prox1 protein distribution patterns in prox1a positive doublets at 36 hpf (n = 21 doublets scored). |