
Fig. 7 S3
- ID
- ZDB-FIG-160205-45
- Publication
- Hesse et al., 2015 - The human ARF tumor suppressor senses blastema activity and suppresses epimorphic tissue regeneration
- Other Figures
- All Figure Page
- Back to All Figure Page
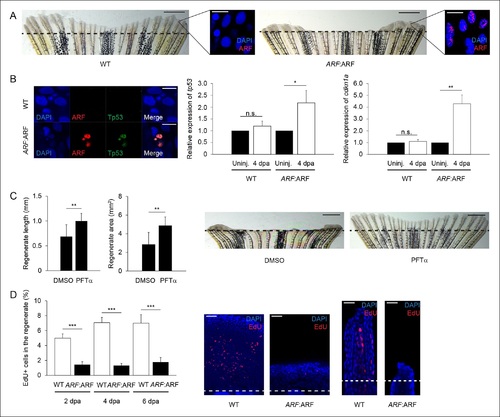
ARF:ARF expression and p53-dependent functions during regeneration. (A) Representative images of wild type (WT) (left) and ARF:ARF (right) fins at 6 dpa. Scale bars: 1 mm. Representative images of ARF expression at 6 dpa in WT (left) and ARF:ARF (right) fins. Scale bars: 10 µm. Dashed lines represent amputation planes. (B) Representative images of ARF and Tp53 in WT and ARF:ARF fins at 4 dpa (left). Scale bar: 10 µm. Tp53 expression is only detected in cells that express ARF. Quantification of relative tp53 (middle) and cdkn1a (right) transcript expression in uninjured (uninj.) WT and ARF:ARF fin and regenerates at 4 dpa (N = 3 replicates). Expression was normalized to β-Actin transcripts and relative to fins within each condition. Significant increases in tp53 (N = 5 fins, p<0.05) and cdkn1a (N = 5 fins, p<0.01) were observed with ARF expression. (C) Quantification of regenerate length and area at 6 dpa in ARF:ARF fins treated with 0.1% Dimethyl sulfoxide (DMSO) or 5 µM Pifithrin-α (PFTα) (left; N = 8 fins/condition, p<0.01). Representative images of fin regeneration at 6 dpa in ARF:ARF fins treated with 0.1% DMSO or 5 µM PFTα (right). Scale bars: 1 mm. Dashed lines represent amputation planes. Treatment with PFTα rescues fin regeneration in ARF:ARF transgenic zebrafish. (D) Quantification of EdU staining at 2, 4, and 6 dpa in WT and ARF:ARF fins (left). At 2 dpa, 5.0% ± 0.6% of cells in WT regenerates were EdU + compared with approximately 1.4% ± 0.4% in hs:ARF regenerates. At 4 dpa, approximately 7.0% ± 0.7% of cells in WT regenerates were EdU + compared with 1.3% ± 0.3% in hs:ARF regenerates. At 6 dpa, approximately 7.0% ± 1.1% of cells in WT regenerates were EdU + compared with 1.8% ± 0.6% in hs:ARF regenerates. Significantly fewer cycling cells are detected with ARF expression (N = 10 fins, p<0.001). Representative (left – sagittal confocal, right – longitudinal) images of EdU staining at 2 dpa in WT and ARF:ARF fins (right). Scale bars: left – 50 µm, right – 25 µm. Dashed lines represent amputation planes. Results are shown as mean ± standard deviation. n.s.: not significant. |