
Fig. 3
- ID
- ZDB-FIG-151228-2
- Publication
- Govindan et al., 2015 - Dynamic remodeling of the extra cellular matrix during zebrafish fin regeneration
- Other Figures
- All Figure Page
- Back to All Figure Page
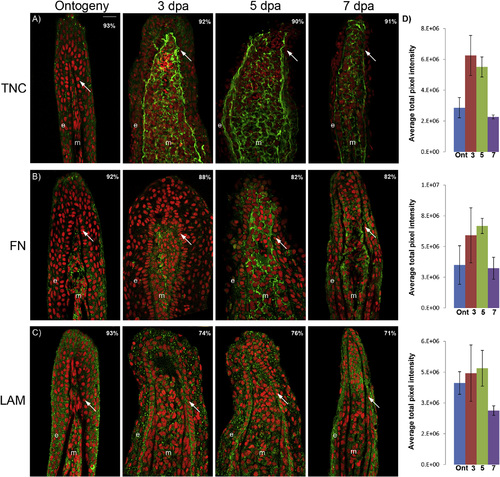
Immunostaining for TNC, FN and LAM during the time course of regeneration. Longitudinal fin sections were treated with the respective primary antibodies and detected using the corresponding secondary antibody conjugated with Alexa Fluor– 488 (green). Propidium iodide (nuclei) is used as the counter stain (red). For each time point under study the percentage of sections showing similar expression pattern is denoted in each panel (n = 40–65 sections). (A) Immunostaining for TNC; (B) immunostaining for FN and (C) immunostaining for LAM. (D) The graph illustrates the overall changes in the expression levels of each of the component under study during the time course of regeneration. Efforts to compare expression levels between components were not completed. Arrows identify the basal layer of epithelium (BLE); m, mesenchyme; e, epidermis dpa, days post amputation. Scale bar is 20 µm. |
| Antibodies: | |
|---|---|
| Fish: | |
| Condition: | |
| Anatomical Terms: | |
| Stage: | Adult |
Reprinted from Gene expression patterns : GEP, 19(1-2), Govindan, J., Iovine, M.K., Dynamic remodeling of the extra cellular matrix during zebrafish fin regeneration, 21-9, Copyright (2015) with permission from Elsevier. Full text @ Gene Expr. Patterns