
Fig. S5
- ID
- ZDB-FIG-151208-11
- Publication
- Teh et al., 2015 - Modulating expression level of secreted Wnt3 influences cerebellum development in zebrafish transgenics
- Other Figures
- All Figure Page
- Back to All Figure Page
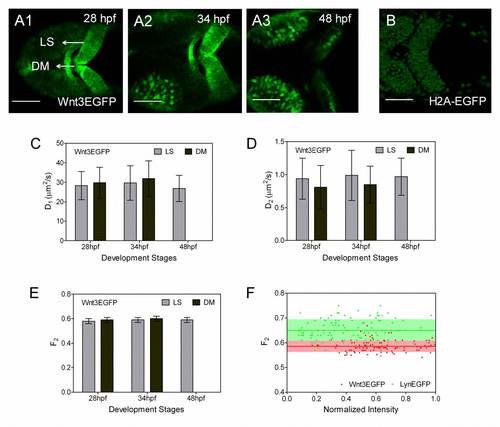
Wnt3EGFP fractions are in a stable equilibrium. (A) Confocal images of zebrafish cerebellum (with optic tectum) expressing Wnt3EGFP at 28 hpf (A1), 34 hpf (A2), 48hpf (A3). The images show that Wnt3EGFP expression level differs in different regions of the cerebellum: lateral side (LS) and dorsal midline (DM). Images were taken in dorsal view. Scale bar, 200 µm. (B) Confocal image of zebrafish cerebellum (with optic tectum) expressing H2A-EGFP at 36 hpf shows that at this stage the nucleus occupies most of the inner space of the cell. Image was taken in dorsal view. Scale bar, 200 µm. (C, D and E) Diffusion coefficients (D1, D2) and fraction of slow moving component (F2) extracted from fit at different development stages and regions in the cerebellum (LS and DM). The expression level in DM at 48 hpf was too low to be measured, therefore only data from LS were acquired. Data are mean ± SD. Light grey bar, LS. Dark grey bar, DM. (F) Fraction of slow moving component (F2) does not change with the protein expressing level, which is indicated by the normalized intensity count rate, for both Wnt3EGFP (red dot) and LynEGFP (green dot). Solid lines represent the mean and areas represent the SD respectively. Abbreviations: Ce: cerebellum; BV: brain ventricle. |