
Fig. S8
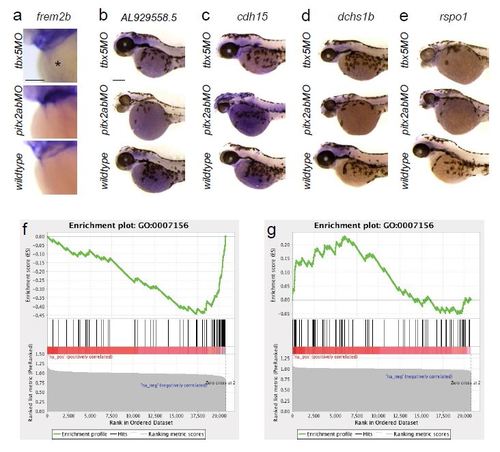
Microarray candidates and GSEA from tbx5a versus pitx2ab morphant analysis. (a-e) mRNA in situ hybridization of genes that are significantly de-regulated in tbx5a versus pitx2ab knockdown conditions; images show head portions of zebrafish embryos at 52-56hpf, anterior to the left; scale bars = 100 µm. (f, g) Analysis of transcriptional profiling results; Gene Set Enrichment Analysis (GSEA) was run using gene lists pre-ranked based on transcriptional changes following knockdown of either pitx2ab or tbx5a (see Methods). Genes annotated as being involved in ‘homophilic cell adhesion’ (GO:0007156) were found to be significantly down-regulated in pitx2ab (f) morphants, and up-regulated in tbx5a (g) morphants (q < 0.05). Within each panel, the enrichment score (ES; upper plot) is a running sum statistic, wherein positive deviation from 0 indicates enrichment for a given gene set at the top of the ranked list, and negative deviation indicates enrichment at the bottom. Barcoding (middle plot) indicates observation of genes from the tested gene set at the indicated position of the ranked list. The bottom plot shows the value of the ranking metric throughout the ordered set. |