
Fig. 1
- ID
- ZDB-FIG-150505-10
- Publication
- Ito et al., 2014 - Differential reparative phenotypes between zebrafish and medaka after cardiac injury
- Other Figures
- All Figure Page
- Back to All Figure Page
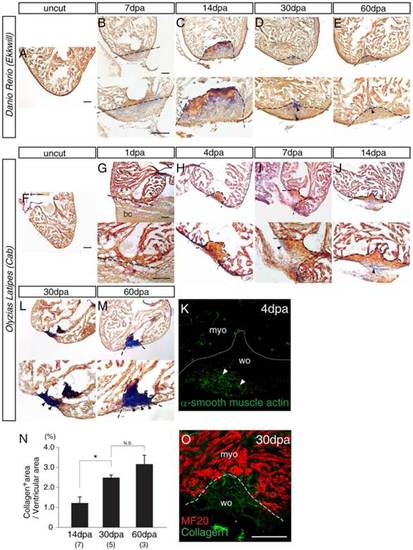
Comparative analysis of the repair process in zebrafish and medaka hearts after ventricular resection. A–L: Cryosections of fish hearts stained with acid fuchsin orange G (AFOG; fibrin, orange; collagen, blue). A–E: Uncut (A) and injured Ekkwill zebrafish hearts (B–E). Fibrin tissues were observed at both 7 (B) and 14 dpa (C), but were absorbed by 30 dpa (D). Collagen was seen from 7 dpa (B) and then was mostly absorbed by 60 dpa (E). F–M: Uncut (F) and injured (G–M) Cab medaka hearts. A blood clot was seen at 1 dpa (G) and was replaced by fibrin by 4 dpa (H). The fibrin was absorbed by 30 dpa (L). Collagen began to accumulate from 7 dpa (I), and this accumulation increased thereafter (J, L, and M). Dense collagenous tissue covered the wound area by 60 dpa (M). Black arrowheads indicate collagen tissues. K: Immunohistochemistry with anti-α-smooth muscle actin antibodies at 4 dpa. White arrowheads indicate putative myofibroblasts. N: Quantification of collagen-positive area ratio indicates scar formation at 30 and 60 dpa. Student′s t-test, *p < 0.05. N.S., not significant. Numbers in parentheses indicate the sample number. O: Immunohistochemistry of MF20 for medaka cardiomyocytes and with anti-collagen I antibodies in the injured area at 30 dpa. The dashed line indicates the approximate injury border. bc, blood clot; myo, myocardium; wo, wound area. Shown are representative images from experiments repeated > 3 times. Scale bars = 100 µm. |