
Fig. 5
- ID
- ZDB-FIG-150430-7
- Publication
- Wen et al., 2013 - Synchronous and asynchronous modes of synaptic transmission utilize different calcium sources
- Other Figures
- All Figure Page
- Back to All Figure Page
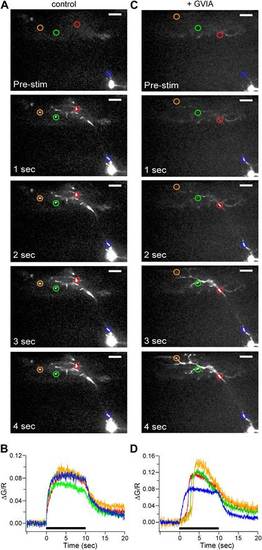
Calcium signal onset is delayed at boutons in ω-conotoxin GVIA-treated fish. (A and C) Sample images of 100 Hz stimulus evoked Fluo-5F fluorescence increases taken at 1 s intervals for 4 ROIs for control (A) and ω-conotoxin GVIA-treated (C) fish. The scale bar corresponds to 20 µm. (B and D) The stimulus-driven fluorescence increases associated with each color-coded ROI in control (B) and ω-conotoxin GVIA-treated (D) fish. The fluorescence was baseline subtracted and the increase was expressed as ΔG/R. Black bars in (B) and (D) indicate the timing of 100 Hz stimulation. Experiments were performed with 0.5 mM EGTA in the intracellular solution. The entire videos for A and C are available as Video 1 and Video 2 respectively. For each video the timing of stimulation is indicated by the dot. |