
Fig. 3
- ID
- ZDB-FIG-150430-5
- Publication
- Wen et al., 2013 - Synchronous and asynchronous modes of synaptic transmission utilize different calcium sources
- Other Figures
- All Figure Page
- Back to All Figure Page
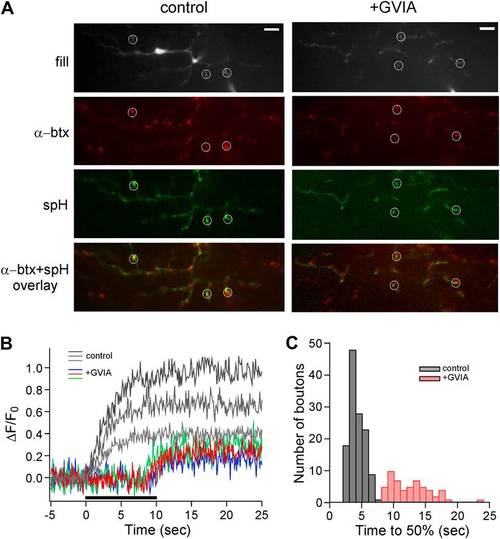
Delayed release in ω-conotoxin GVIA-treated fish is also observed by means of the exocytotic indicator synaptopHluorin. (A) Images taken from a single focal plane of the CaP motor neuron terminals showing the motor neuron fill with Alexa Fluor 647 (gray), postsynaptic labeling with α-btx (red), peak stimulus-induced synaptopHluorin fluorescence (green) and α-btx/synaptopHluorin overlay. These images are shown for a single control (left) and ω-conotoxin GVIA-treated (right) fish. The scale bar corresponds to 10 µm. (B) Stimulus-driven fluorescence change, expressed as ΔF/F0 for the three representative boutons shown for control (gray) and ω-conotoxin GVIA treated (colored) synaptopHluorin motor neurons. The synaptopHluorin signal was measured at each ROI during the time course of 100 Hz stimulation (indicated by the black bar in B). (C) The histogram showing time required to reach 50% maximal fluorescence increase for boutons of control (gray, 127 boutons from 8 fish) and ω-conotoxin GVIA-treated fish (red, 55 boutons from 4 fish). Experiments were performed with 5 mM EGTA in the intracellular solution. |