
Fig. 7
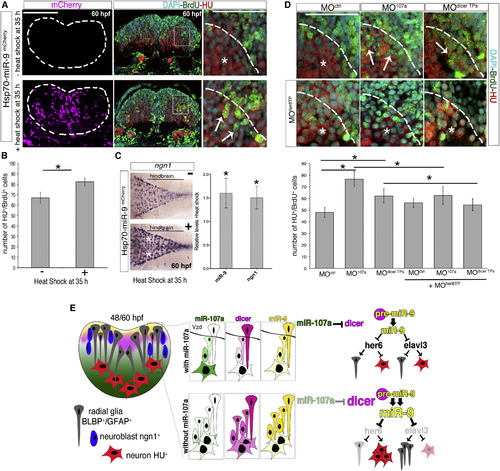
The Increase of miR-9 Accumulation Promotes Hindbrain Neurogenesis in the Absence of miR-107 and Dicer Posttranscriptional Regulation (A) Comparison of the number of BrdU/HU double positive cells in embryos injected with the Hsp70-miR-9mCherry plasmid with or without heat-shock. mCherry-positive cells (purple) indicate the cells overexpressing miR-9. HU, BrdU, and DAPI triple staining was performed in the same hindbrain cross-section at 60 hpf. White arrows in the high-magnification (60×) pictures indicate increased number of BrdU/HU double-positive cells migrating in the mantle area (dashed line). (B) Number of BrdU and HU double-positive cells. Data are presented as mean ± SEM (n = 5 embryos each group). p < 0.05. (C) Expression of ngn1 in 60 hpf embryos treated as described above. Dorsal is up and anterior is left. White stars indicate ngn1 expression observed in 30% ± 5% of the heat-shocked embryos (n = 15) compared with the ngn1 expression in non-heat-shocked embryos (n = 20). The chart shows the quantification by qRT-PCR of miR-9 and ngn1 expression level in the brain of 60 hpf embryos treated as above and following heat shock. Levels are relative to the control without heat shock. Data are presented as mean ± SEM (n = 3). p < 0.05. (D) High magnifications (60×) of hindbrain cross-sections showing BrdU/HU double-positive cells in embryos at 60 hpf injected with MOctrl, MO107a, or MOdicer TPs with or without MOher6TP. Whole cross-sections are shown in Figure S5D. Arrows indicate the BrdU/HU double-positive cells. Stars indicate DAPI nuclei of BrdU-negative and HU-positive cells in the same area. The chart shows the number of HU and BrdU double-positive cells in the indicated treatment. Data represent the mean ± SEM (n = 6 to 9 embryos for each experimental condition). p < 0.05. (E) Schematic representation of the miR-107 (green)-dicer (pink) signaling pathway controlling miR-9 (yellow) biogenesis during hindbrain neurogenesis. Scale bars represent 50 µm. |
| Fish: | |
|---|---|
| Knockdown Reagents: | |
| Observed In: | |
| Stage: | Pec-fin |
Reprinted from Developmental Cell, 32(5), Ristori, E., Lopez-Ramirez, M.A., Narayanan, A., Hill-Teran, G., Moro, A., Calvo, C.F., Thomas, J.L., Nicoli, S., A Dicer-miR-107 Interaction Regulates Biogenesis of Specific miRNAs Crucial for Neurogenesis, 546-60, Copyright (2015) with permission from Elsevier. Full text @ Dev. Cell