
Fig. 3
- ID
- ZDB-FIG-150420-22
- Publication
- Kobitski et al., 2015 - An ensemble-averaged, cell density-based digital model of zebrafish embryo development derived from light-sheet microscopy data with single-cell resolution
- Other Figures
- All Figure Page
- Back to All Figure Page
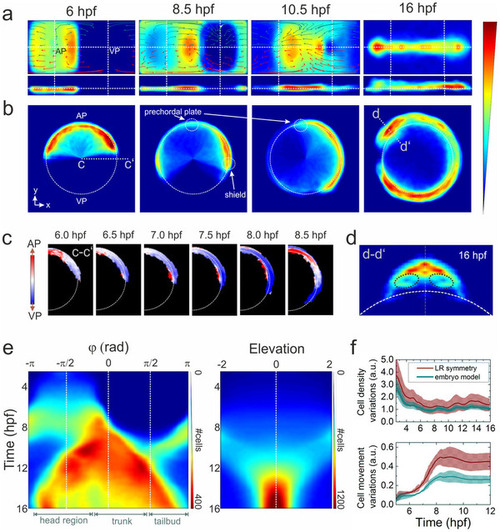
Ensemble-averaged digital model. (a) Averaged cell density cylindrical projections in spherical coordinates (azimuth vs. elevation). The vector fields represent 2h collective cell migration patterns, computed by locally averaging the displacement of cells with R < 1 (red arrows) and R > 1 (dark cyan). For symmetry reasons, only half of each vector field is shown. (b) Planar projections in Cartesian coordinates at selected times; the dashed white line indicates the embryo sphere, and the blue-to-red color code represents the normalized cell density (in arbitrary units). (c) Projection of cell density movement at the embryo dorsal side from 6 to 8.5hpf; the direction is encoded by color (toward the AP: red, toward the VP: blue). (d) Cell density projection at 16hpf at a cross-section through the head region (d–d2) depicted in panel (b); the dashed black lines mark the eye positions. The color code is the same as in (a) and (b). (e) Kymographs of azimuthal (left panel) and elevation (right panel) cell density projections; the color code denotes the number of cells per azimuthal or elevation segment, respectively. (f) Quantitative analysis of cell density (upper panel) and movement (lower panel) variations with respect to the midline mirror (left-right) symmetry (within each sample) and to the model. The solid lines represent averages over the ensemble; the shaded regions around the lines depict the ±σ values of statistical significance that include sample heterogeneity as well as statistical errors due to cell number variations within voxels (σ2 = (σsamples)2 + (σΔN )2). |