
FIGURE
Fig. 1
- ID
- ZDB-FIG-150420-20
- Publication
- Kobitski et al., 2015 - An ensemble-averaged, cell density-based digital model of zebrafish embryo development derived from light-sheet microscopy data with single-cell resolution
- Other Figures
- All Figure Page
- Back to All Figure Page
Fig. 1
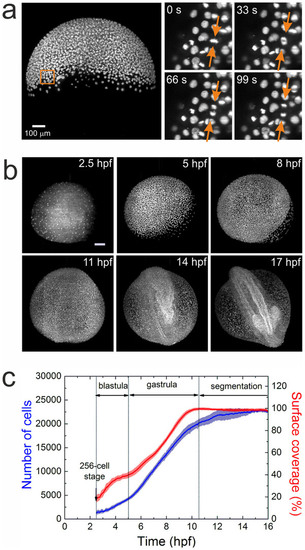
Imaging and quantification of embryo development. (a) MIP image of an embryo at 50% epiboly; a sequence of four time-lapse images from a selected region (square) is shown on the right. The arrows point to a dividing cell. (b) Typical maximum intensity projection images of a zebrafish embryo at 2.5, 5, 8, 11, 14, and 17hpf. Scale bar is 100µm. (c) Time dependence of the average cell number and yolk surface coverage during embryo development, computed from an ensemble of five embryos. |
Expression Data
Expression Detail
Antibody Labeling
Phenotype Data
Phenotype Detail
Acknowledgments
This image is the copyrighted work of the attributed author or publisher, and
ZFIN has permission only to display this image to its users.
Additional permissions should be obtained from the applicable author or publisher of the image.
Full text @ Sci. Rep.