|
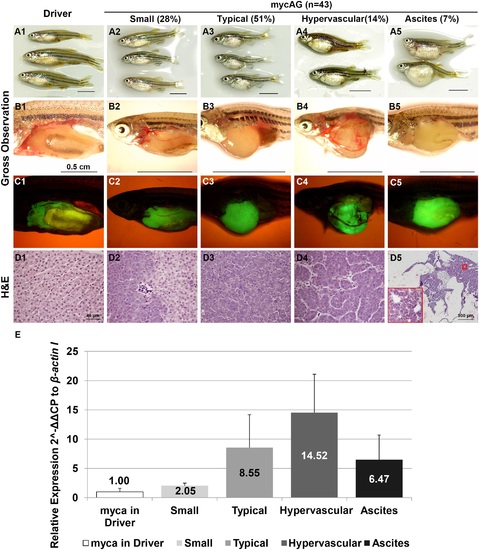
Diverse liver tumor phenotypes of mycAG zebrafish at 6 mpi. MycAG fish were induced by 2 µM mifepristone from 1 mpf and sampled at 7 mpf (6 mpi) for gross observation and histological examination. Four phenotypes were observed: Small, Typical, Hypervascular and Ascites, as indicated at the top of the figure with total numbers and percentages. (A1–A5) Exterior observation of each phenotype. (B1–B5) Gross observation of liver tumors after removal of body wall. (C1 to C5) The same views as those in (B1–B5) for observation of GFP expression that illustrate the shape of livers. (D1–D5) H&E staining of liver sections. (D1–D4) have the same magnification as indicated in scale bar in (D1). The scale bar in (D1) represents magnification for all of (D1–D4) and blow-up area in (D5). (E) Transgenic mycAG expression in each phenotype. Transgenic mycAG expression in the liver was measured by RT-qPCR and the level of expression was relative to baseline myca expression in the control Driver fish.
|