|
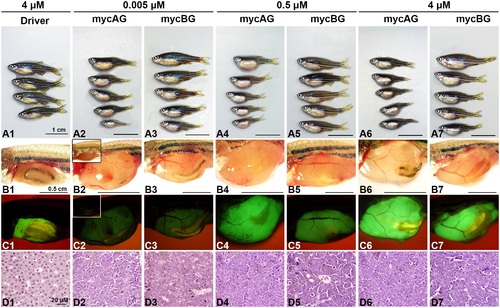
Liver tumor progression in mycAG and mycBG fish. MycAG fish and mycBG fish were induced with mifepristone of increasing concentrations, as indicated at the top of the figure, from 1 mpf and sacrificed at 2 mpi (3 mpf). (A1–A7) Exterior observation of fish from each treatment group. (B1–B7) Gross observation of liver tumors after removal of abdominal wall. (C1 to C7) The same views as those in (B1–B7) for observation of GFP expression that illustrate the shape of livers. In B2 and C2, images from uninduced mycAG fish are included as insets for comparison and there were no enlarged liver (B2) and no visible GFP expression in the liver although green fluorescent signals was observed in the gut in some fish (C2). (D1–D7) H&E staining of liver sections.
|