
Fig. 1
- ID
- ZDB-FIG-150331-36
- Publication
- Wakayama et al., 2015 - Cdc42 Mediates Bmp-Induced Sprouting Angiogenesis through Fmnl3-Driven Assembly of Endothelial Filopodia in Zebrafish
- Other Figures
- All Figure Page
- Back to All Figure Page
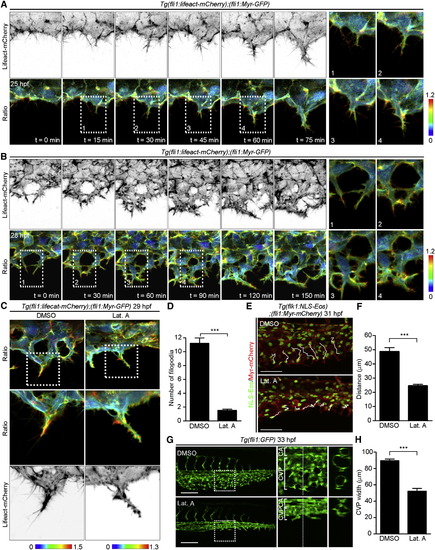
Filopodia Are Required for EC Migration during CVP Formation (A and B) 3D-rendered confocal images of the CVP of Tg(fli1:lifeact-mCherry);(fli1:Myr-GFP) embryos at 25 hpf (A) and 28 hpf (B) and their subsequent time-lapse images at the indicated time points. Upper row: mCherry images (intensity of Lifeact-mCherry is shown as a grayscale image); lower row, mCherry/GFP ratio images shown in the IMD mode (Ratio). The upper and lower limits of the ratio range are indicated on the right. The boxed areas labeled with numbers 1–4 are enlarged on the right side. (C) 3D-rendered confocal images of the CVP of Tg(fli1:lifeact-mCherry);(fli1:Myr-GFP) embryos treated with DMSO or 0.1 µg/ml Lat. A from 26 to 29 hpf. Top: ratio images of mCherry/GFP; middle: enlarged images of the boxed areas; bottom: enlarged mCherry images of the boxed areas. The upper and lower limits of the ratio range are indicated on the bottom. (D) The number of filopodia for each EC located at the vascular front, as observed in (C), was quantified as described in the Experimental Procedures and shown as the mean ± SEM (DMSO, n = 10; Lat. A, n = 12). (E) Projection view of confocal z stack images of the CVP of Tg(flk1:NLS-Eos);(fli1:Myr-mCherry) embryos treated with DMSO or Lat. A from 25 to 31 hpf. The merged images of Eos (green) and mCherry (red) are superimposed on the migration paths of ECs (white lines) inferred from time-lapse confocal movies taken from 25 to 31 hpf. (F) The EC migration distance, as observed in (E), was quantified and is shown as the mean ± SEM (DMSO, n = 6; Lat. A, n = 6). (G) Projection view of confocal z stack images of the caudal regions of Tg(fli1:GFP) embryos treated with DMSO or Lat. A from 24 to 33 hpf. The boxed areas in the left panel are enlarged in the middle panel. The cross-sectional single-plane images of the areas indicated by dotted lines on the enlarged images are shown in the right column. CA, caudal artery. (H) The CVP width, as observed in (G), was quantified and is shown as the mean ± SEM (DMSO, n = 8; Lat. A, n = 8). Scale bars, 50 µm in (E) and (G). All zebrafish images are shown dorsal to the top and anterior to the left, unless otherwise described. p < 0.001. See also Figure S1 and Movies S1, S2, and S3. |
| Genes: | |
|---|---|
| Fish: | |
| Condition: | |
| Anatomical Terms: | |
| Stage Range: | Prim-5 to Prim-15 |
| Fish: | |
|---|---|
| Condition: | |
| Observed In: | |
| Stage Range: | Prim-5 to Prim-15 |
Reprinted from Developmental Cell, 32, Wakayama, Y., Fukuhara, S., Ando, K., Matsuda, M., Mochizuki, N., Cdc42 Mediates Bmp-Induced Sprouting Angiogenesis through Fmnl3-Driven Assembly of Endothelial Filopodia in Zebrafish, 109-22, Copyright (2015) with permission from Elsevier. Full text @ Dev. Cell