
Fig. 2
- ID
- ZDB-FIG-150326-23
- Publication
- Itou et al., 2014 - Regenerative responses after mild heart injuries for cardiomyocyte proliferation in zebrafish
- Other Figures
- All Figure Page
- Back to All Figure Page
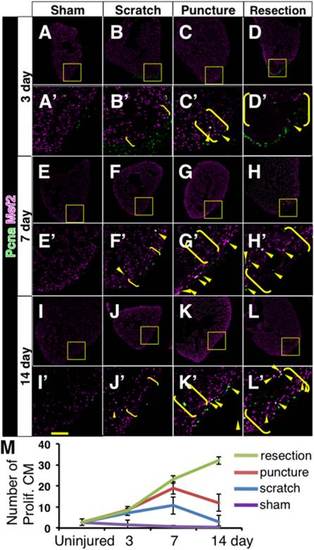
Cardiomyocyte proliferation after different damages to the heart. A–L, A′–L′: Representative images of MEF2 (magenta) and PCNA (green) immunostaining at 3 dpi (A–D, A′–D′), 7 dpi (E–H, E′–H′), and 14 dpi (I–L, I′–L′) after sham operation (A, A′, E, E′, I, I′), scratch- (B, B′, F, F′, J, J′), puncture- (C, C′,G, G′, K, K′), and resection- (D, D′, H, H′, L, L′) induced injury. Yellow arrowheads point to proliferating cardiomyocytes, observed as white signals. A′–L′ show close-up images of the boxed areas in A–L. Brackets indicate the injury sites. Scale bar = 50 µm. M: A graphic representation of the number of proliferating cardiomyocytes at indicated time points after different injury methods. Shown are average ± S.D. (n=3). CM, cardiomyocyte. |