
Fig. 6
- ID
- ZDB-FIG-150324-17
- Publication
- Liu et al., 2015 - Molecular evolution and functional divergence of zebrafish (Danio rerio) cryptochrome genes
- Other Figures
- All Figure Page
- Back to All Figure Page
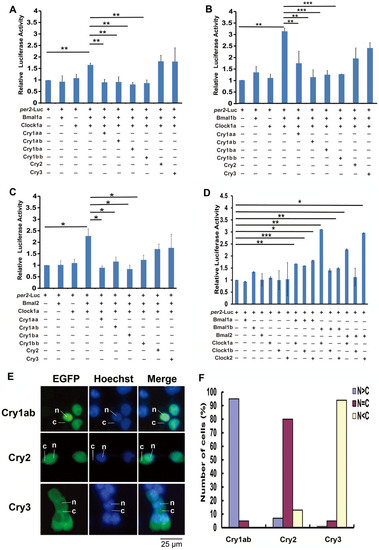
Repression of zebrafish Cry proteins on different Clock:Bmal combinations. (A) Clock1a:Bmal1a combination, (B) Clock1a:Bmal1b combination and (C) Clock1a:Bmal2 combination. (D) All possible Clock:Bmal combinations. Each value is the mean ± SD of the three independent experiments. Results were analyzed by ANOVA. One star on the line indicates 0.01 < p < 0.05, two stars on the line p < 0.01, and three stars on the line p < 0.001. (E) Sub-cellular localizations of zebrafish Cry1ab, Cry2 and Cry3. Cry1ab-EGFP, Cry2-EGFP or Cry3-EGFP was transfected into HEK293 cells, respectively, and then the cells were stained with Hoechst and observed by an inverted fluorescent microscopy. The cytoplasmic or nuclear distribution of zebrafish Cry1ab, Cry2 or Cry3 was detected by GFP signal (green); DNA was stained by Hoechst (blue), respectively. The leader lines and letters N, C indicate the location of nucleus and cytoplasm, respectively. (F) Quantitative analysis of the subcellular localization of each Cry proteins. In each experiment, 50–100 cells were evaluated for nuclear fluorescence (N > C, blue bars), nuclear-cytoplasmic fluorescence (N = C, purple bars), and cytoplasmic fluorescence (N < C, pink bars). The figure shows a representative of the three independent experiments. |