
Fig. 4
- ID
- ZDB-FIG-150309-42
- Publication
- Freisinger et al., 2014 - Live Imaging and Gene Expression Analysis in Zebrafish Identifies a Link between Neutrophils and Epithelial to Mesenchymal Transition
- Other Figures
- All Figure Page
- Back to All Figure Page
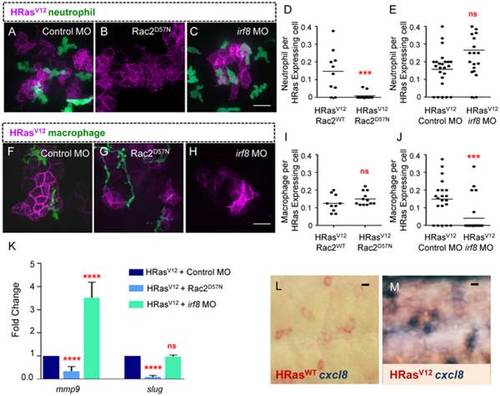
Neutrophils, but not macrophages, mediate EMT related gene expression in HRasV12 expressing epithelial cells. (A–C) Fluorescent Z stack projections of live 3.5 dpf transgenic mpx:GFP (green neutrophils) control MO injected (A), Rac2D57N (B) and irf8 MO (C) larvae expressing HRasV12. (D–E) Quantification of neutrophil recruitment (as a ratio of neutrophils per transformed cell) shows a significant decrease in neutrophil recruitment to HRasV12 expressing cells in RacD57N embryos when compared to controls (D), no significant change was observed in neutrophil recruitment in irf8 morphant larvae compared to control (E). (F–H) Fluorescent Z stack projections of live 3.5 dpf of transgenic mpeg:Dendra (green macrophages) control MO injected (F), Rac2D57N (G) and irf8 MO (H) larvae expressing HRasV12. (I–J) Quantification of macrophage recruitment (as a ratio of macrophages per transformed cell) shows a significant decrease in macrophage recruitment to HRasV12 expressing cells in irf8 morphants compared to controls (D). No significant change was observed in macrophage recruitment in Rac2D57N larvae compared to control (E). (K) Quantitative RT-PCR (one representative graph shown n = 4) indicates a statistically significant decrease in mmp9 and slug transcripts in transformed cells from Rac2D57N larvae compared to control MO injected larvae while no significant decrease was seen in mmp9 and slug transcripts in transformed cells from irf8 Mo injected larvae compared to controls. (L–M) Double label WMISH with HRasWT (A) and HRasV12 (B) transcript labeled in red and cxcl8 transcript label in blue. cxcl8 expression is induced in HRasV12 expressing larvae compared to control HRasWT expressing larvae. *** = P<.001, **** = P<.0001, ns = not significant. Scale bar = 20 microns. |