
Fig. 3
- ID
- ZDB-FIG-150309-41
- Publication
- Freisinger et al., 2014 - Live Imaging and Gene Expression Analysis in Zebrafish Identifies a Link between Neutrophils and Epithelial to Mesenchymal Transition
- Other Figures
- All Figure Page
- Back to All Figure Page
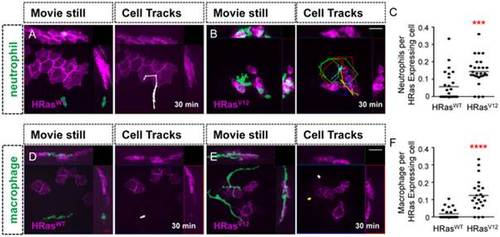
Leukocytes are recruited to HRasV12 expressing epithelial cells. (A–B) Analysis of time-lapse movies of control HRasWT expressing epithelial cells (A and D) and HRasV12 expressing epithelial cells (B and E) in 3.5 dpf transgenic mpx:GFP (green neutrophils) larvae (A–B) and 3.5 dpf transgenic mpeg:Dendra (green macrophage) larvae (D–E). For cell tracks leukocyte migration was tracked every 2 minutes for 30 minutes. (C) Quantification of A–B (as a ratio of neutrophils per transformed cell) confirms a statistically significant increase in neutrophil recruitment to HRasV12 expressing cells compared to HRasWT expressing cells. (F) Quantification of D–E (as a ratio of macrophages per transformed cell) confirms a statistically significant increase in macrophage recruitment to HRasV12 expressing cells when compared to macrophages recruited to HRasWT expressing cells. dpf = days post fertilization, scale bar = 20 microns, *** = p<.001 **** = p<.0001. |