
Fig. 1
- ID
- ZDB-FIG-141205-8
- Publication
- Salta et al., 2014 - A Self-Organizing miR-132/Ctbp2 Circuit Regulates Bimodal Notch Signals and Glial Progenitor Fate Choice during Spinal Cord Maturation
- Other Figures
- All Figure Page
- Back to All Figure Page
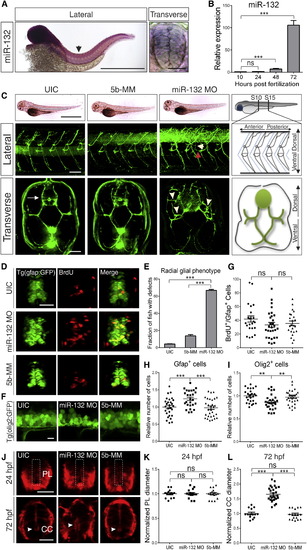
miR-132 Downregulation Causes Glial and Spinal Cord Maturation Deficits (A) In situ hybridization of miR-132 at 48 hpf. Expression of miR-132 in the spinal cord (whole mount) and in the radial glial cells (cross-section). Arrowhead indicates region of cross-sectioning. Scale bars, 1 mm (lateral view); 4 µm (cross-section). (B) Semiquantitative real-time PCR analysis of miR-132 expression in wild-type embryos and larvae at 10, 24, 48, and 72 hpf. Values were normalized to the U6 small nuclear RNA. (C) miR-132 knockdown using an antisense morpholino. Top: Bright-field images of UIC, larvae injected with a 5b-MM or a morpholino against miR-132 (miR-132 MO) at 72 hpf, and schematic illustration of a zebrafish larva indicating the trunk region between S10 and S15 used to score the phenotypes. Scale bar, 1 mm. Middle: Lateral views of the trunk. The Gfap+ glial processes are immunostained with zrf-1. White arrowhead indicates intraprocess ectopic branches. Red arrowhead indicates ectopic branch connecting two neighboring processes. Schematic illustration depicts a sagittal view of the perineural glial processes. Scale bar, 50 µm. Bottom: Cross-sections of the trunk immunostained with zrf-1. Arrow indicates the spinal cord. Arrowheads indicate ectopic branches. Schematic illustration depicts a transverse section showing the normal arborization pattern of glial processes. Scale bar, 10 µm. (D) Transverse sections of the spinal cord of Tg(gfap:GFP) embryos after BrdU incorporation at 48 hpf, quantified in (G) and (H). Scale bar, 4 µm. (E) Quantification of the Gfap+ glial arborization defects in miR-132 morphants. Sample sizes: n = 172 for UIC; n = 132 for 5b-MM; and n = 195 for miR-132 MO. (F) Lateral view of the spinal cord of miR-132 morphant and control Tg(olig2:GFP) embryos at 48 hpf, quantified in (I). Scale bar, 10 µm. (G and H) Quantification of proliferating glial progenitors and of total number of progenitors. Values were expressed as percentage of BrdU-positive (BrdU+) cells to total number of Gfap+ cells within the spinal cord (G) or as total number of Gfap+ cells (H). (I) Quantification of the total number of oligodendrocyte lineage precursor cells at 48 hpf. (J) Spinal cord cross-sections of miR-132 morphants (miR-132 MO) and controls immunostained with zrf-1 depicting the primitive lumen (dashed rectangle, PL) at 24 hpf or the central canal (arrowheads, CC) at 72 hpf. Scale bars, 4 µm. (K and L) Quantification of the diameter of the primitive lumen (K) or the central canal (L) in miR-132 morphants and controls. In (G) through (I), (K), and (L) each dot of the scatterplot represents the normalized average from four serial optical sections (z stacks) of one spinal cord cross-section per embryo. Values are presented as mean ± SEM. *p < 0.05; **p < 0.01; ***p < 0.001; ns, nonsignificant. See also Figures S1 and S2. |
| Genes: | |
|---|---|
| Antibody: | |
| Fish: | |
| Knockdown Reagent: | |
| Anatomical Terms: | |
| Stage Range: | Prim-5 to Protruding-mouth |
| Fish: | |
|---|---|
| Knockdown Reagent: | |
| Observed In: | |
| Stage: | Protruding-mouth |
Reprinted from Developmental Cell, 30(4), Salta, E., Lau, P., Sala Frigerio, C., Coolen, M., Bally-Cuif, L., De Strooper, B., A Self-Organizing miR-132/Ctbp2 Circuit Regulates Bimodal Notch Signals and Glial Progenitor Fate Choice during Spinal Cord Maturation, 423-36, Copyright (2014) with permission from Elsevier. Full text @ Dev. Cell