
Fig. 1
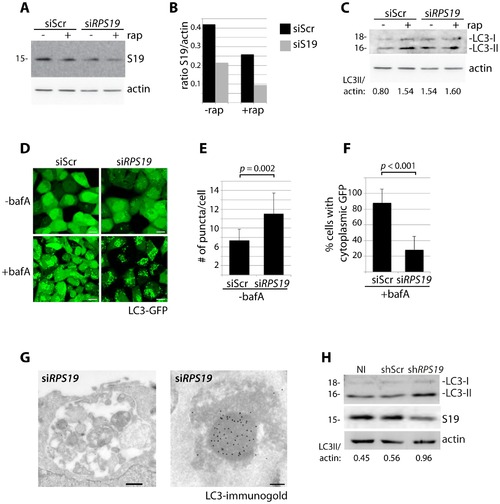
Knock down of RPS19 induces autophagy. (A) Western blot analysis of RPS19 expression in GFP-LC3 HEK cells transfected with siScr or siRPS19 and either untreated or treated with 100 nM rapamycin overnight (B). Densitometer analysis of the ratio of RPS19 to actin expression from Fig. 1A. (C) Western blot analysis of LC3 expression in GFP-LC3 HEK cells transfected with siScr or siRPS19 either untreated or treated with 100 nM rapamycin overnight. (D) Confocal analysis of GFP-LC3 HEK cells transfected with siScr or siRPS19 and either untreated or treated with 50 nM bafilomycin A for 4 hours. Size bars = 10 µM. (E) Quantification of the number of GFP-LC3 puncta per cell from Fig. 1D. At least 8 shots from 3 independent transfections are quantified. (F) Quantification of the percent of cells in Fig. 1D with cytoplasmic GFP-LC3. (G) Representative electron micrographs of GFP-LC3 HEK cells transfected with siRPS19 and immunogold labeled with LC3 antibodies. Size bar on left panel = 500 nM, on right panel = 200 nM. (H) Western blot analysis of LC3 expression in CD34+ cells either not infected (NI), infected with a scrambled control (shScr) or infected with a shRNA against RPS19 (shRPS19). |