
Fig. S10
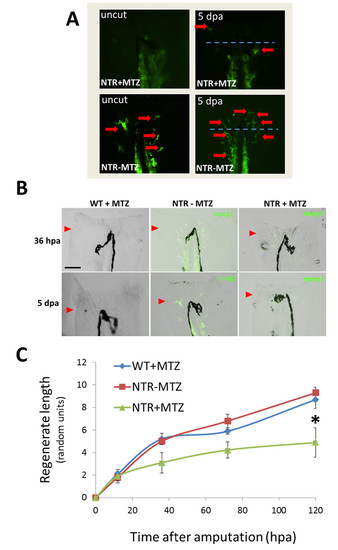
Macrophage depletion negatively affects larval fin regeneration. (A) cMacrophages were continuously ablated before and after larval fin resection (up to 5 dpa) using the macrophage ablation fish line Tg(mpeg1:NTReYFP). Representative YFP images of macrophages in both uncut and 5 dpa transgenic larvae. Red arrows indicate individual macrophages. Blue dotted line indicates original cut site. (B) Representative whole fin hybrid DIC/YFP images of wild-type fish or Tg(mpeg1:NTR-eYFP) fish undergoing continuous macrophage ablation after resection. Red arrows point toward original cut line. (C) Quantification of regenerated tissue as a percentage of original fin area for macrophage-ablated fish (NTR+MTZ, N=9), wild type fish (WT+MTZ, N=11) and transgenic fish controls (NTR-MTZ, N=14). Full regeneration to the original fin area is identical to 100% regeneration. Numbers are compiled and averaged over two separate experiments using identical conditions. *P (5dpa) = 0.0314 (two-tailed). |