
Fig. 3
- ID
- ZDB-FIG-140603-1
- Publication
- Koch et al., 2014 - Spatial and temporal expression patterns of chitinase genes in developing zebrafish embryos
- Other Figures
- All Figure Page
- Back to All Figure Page
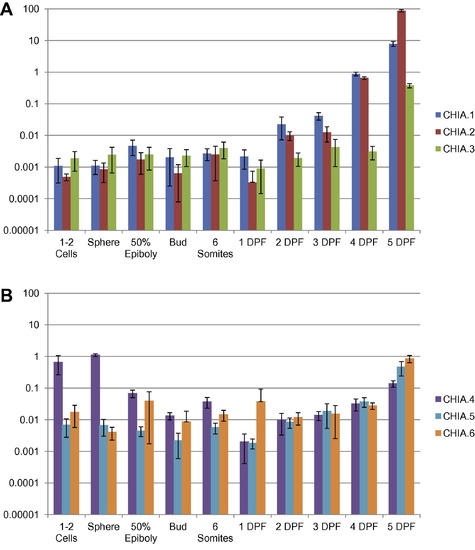
Relative quantification of zebrafish CHIA gene expression at ten stages of development. qPCR measurements of gene expression are shown from the 1 to 2 cells stage until 5 days post fertilization. The house keeping genes RNA polymerase II and 18S ribosomal subunit were used to normalize the measurements. According to quantitative gene expression levels, the CHIA genes can be roughly divided into two groups: (A) CHIA.1, CHIA.2, and CHIA.3 have very low levels of expression at the earliest developmental stages, but these rise sharply from day 3 to 4. (B) CHIA.4, CHIA.5 and CHIA.6 are more highly expressed at the earliest stages followed by a slower increase in expression. Interestingly, the CHIA.4 has an apparent maximum at the sphere stage and expression decreases at later stages, after the maternal to zygotic transition. Error bars indicate standard deviations. |
| Genes: | |
|---|---|
| Fish: | |
| Anatomical Term: | |
| Stage Range: | 1-cell to Day 5 |
Reprinted from Gene expression patterns : GEP, 14(2), Koch, B.E., Stougaard, J., and Spaink, H.P., Spatial and temporal expression patterns of chitinase genes in developing zebrafish embryos, 69-77, Copyright (2014) with permission from Elsevier. Full text @ Gene Expr. Patterns