
FIGURE
Fig. S1
- ID
- ZDB-FIG-140416-29
- Publication
- Staudt et al., 2014 - High-resolution imaging of cardiomyocyte behavior reveals two distinct steps in ventricular trabeculation
- Other Figures
- All Figure Page
- Back to All Figure Page
Fig. S1
|
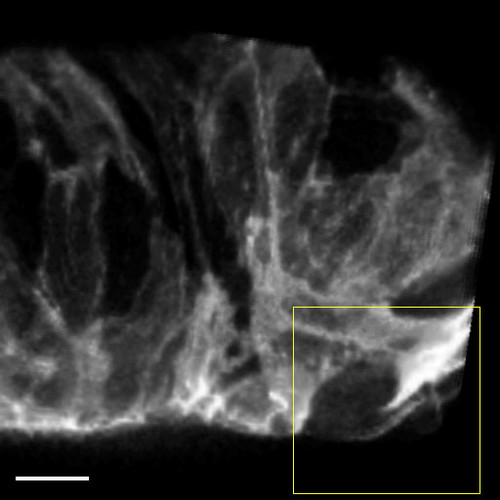
Visualization of cardiomyocyte division. (A) 3D view of a 78 hpf Tg(myl7:ras-GFP) heart. Yellow box marks area of interest in (B). (B) Zoom in on dividing cardiomyocyte. Arrows point to cleavage furrow. Cell membranes are highlighted with dotted lines. By the last panel, the cardiomyocyte has divided, and the membranes of the two daughter cells are highlighted in different colors. Part of the membrane on the right is obscured by an overlying cardiomyocyte. Time into the movie is indicated in hours:minutes. Scale bars, 10μm. 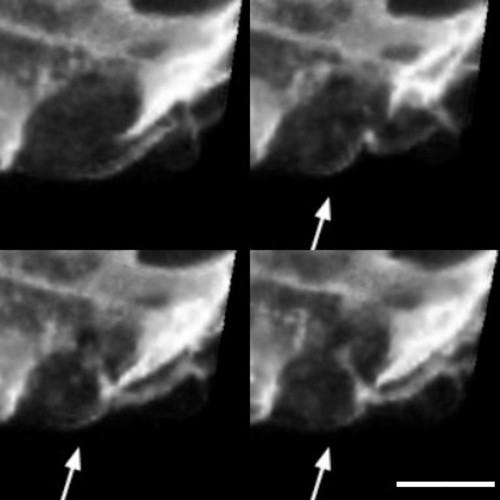
|
Expression Data
Expression Detail
Antibody Labeling
Phenotype Data
Phenotype Detail
Acknowledgments
This image is the copyrighted work of the attributed author or publisher, and
ZFIN has permission only to display this image to its users.
Additional permissions should be obtained from the applicable author or publisher of the image.
Full text @ Development