
Fig. 4
- ID
- ZDB-FIG-140320-18
- Publication
- Essner et al., 2000 - Mesendoderm and left-right brain, heart and gut development are differentially regulated by pitx2 isoforms
- Other Figures
- All Figure Page
- Back to All Figure Page
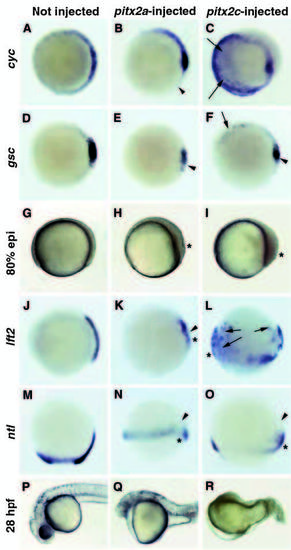
Ectopic expression of pitx2a and pitx2c disrupts mesendoderm formation. Embryos were injected at the 1-2 cell stage with RNA. (A,D,G,J,M,P) Control or uninjected embryos. (B,E,H,K,N,Q) pitx2a-injected embryos. (C,F,I,L,O,R) pitx2c injected embryos. (A-C) Expression of cyc at 40% epiboly; animal pole views with dorsal to the right. (B) pitx2a-injected embryo with arrowhead marking reduced expression of cyc in the margin. (C) pitx2c-injected embryo with arrows marking regions of increased cyc expression. (D-F) gsc expression at 40% epiboly; animal pole views with dorsal to the right. (E) A reduced number of cells with gsc expression in a pitx2a-injected embryo (arrowhead). (F) pitx2c injected embryo with less gsc positive cells on the dorsal side (arrowhead) and ectopic activation of gsc expression in other marginal cells (arrow). (G-I) Lateral view of embryos at 80% epiboly. (G) Control embryo with dorsal to the right. (H,I) pitx2aand pitx2c-injected embryos displaying slowed epiboly and excess cells at the blastoderm margin (asterisks). (J-L) Expression of lft2 at 80% epiboly. (K,L) Asterisks mark an increased number of cells at the margin, arrowhead shows reduced expression, and arrows designate regions of ectopic expression of lft2. (M-O) Expression of ntl/brachyury at 80-90% epiboly. (M) Control embryo with dorsal to the right. (N,O) pitx2a- and pitx2c-injected embryos displaying slowed epiboly and a lack of dorsal accumulation of ntl (arrowheads). Asterisks mark an increased number of cells at the margin. (P-R) Lateral view of 28 hpf embryos with anterior to left. |