
Fig. 1
- ID
- ZDB-FIG-140106-6
- Publication
- Moore et al., 2013 - Post-transcriptional mechanisms contribute to Etv2 repression during vascular development
- Other Figures
- All Figure Page
- Back to All Figure Page
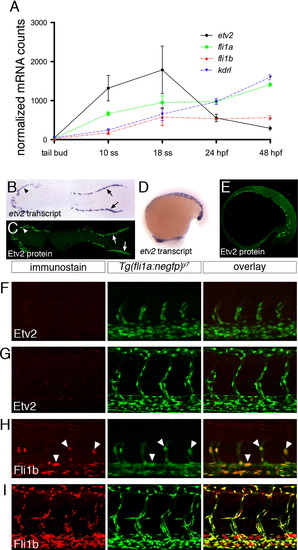
Etv2 is down-regulated during vascular development. (A) Graph of nCounter quantification for etv2, fli1a, fli1b, and kdrl at the indicated developmental stages. Values are normalized to actb2 (beta-actin) and eef1a1l1(ef1alpha). (B, D) Whole mount in situ hybridization using an antisense etv2 riboprobe at 5ss and 18ss. (C, E) Embryos at 5 ss and 18 ss immunostained with Etv2 antibody and anti-rabbit Alexa-488. (B, C) Dorsal views of flat-mounted embryos, anterior to the left. (D, E) Lateral views, anterior to the left. (F–I) Two-photon micrographs of trunk vessels in fixed Tg(fli1a:negfp)y7 embryos immunostained with antibodies against (F, G) Etv2 or (H, I) Fli1b. Left panels, immunostained protein detected with Alexa-568 secondary antibody. Middle panels, transgenic expression of nuclear localized EGFP. Right panels, overlay of Alexa-568 and EGFP signals. Embryos at (F, H) 25 hpf or (G, I) 48 hpf. |
Reprinted from Developmental Biology, 384(1), Moore, J.C., Sheppard, S., Shestopalov, I.A., Chen, J.K., and Lawson, N., Post-transcriptional mechanisms contribute to Etv2 repression during vascular development, 128-40, Copyright (2013) with permission from Elsevier. Full text @ Dev. Biol.