
Fig. S1
- ID
- ZDB-FIG-140106-5
- Publication
- Moore et al., 2013 - Post-transcriptional mechanisms contribute to Etv2 repression during vascular development
- Other Figures
- All Figure Page
- Back to All Figure Page
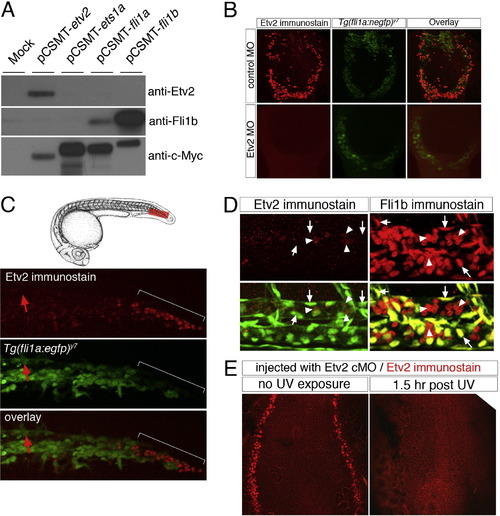
Etv2 protein expression. (A) SDS–PAGE gel of HEK293T lysates transfected with CMV-driven expression vectors encoding myc-tagged zebrafish Etv2, Ets1a, Fli1a, Fli1b, or left untransfected (mock). Lysates from each sample were run on triplicate immunoblots, which were individually probed with Etv2 or Fli1b polyclonal antiserum, or a monoclonal against the myc-epitope (9E10). The Etv2 polyclonal serum recognizes a single band that is the same size as that recognized following immunodetection for the myc epitope. (B) Tg(fli1a:negfp)y7 embryos at 18 hpf injected with 5 ng of control or Etv2 MO followed by immunostaining using Etv2 polyclonal serum and Alexa-568 secondary. Etv2 antibody staining is clearly visible in embryos injected with control MO, but absent in embryos injected with 5 ng of an Etv2 translation blocking morpholino. (C) Top, camera lucida drawings of embryo at approximately 24 hpf. Bottom, immunostaining of an Tg(fli1a:egfp)y1 embryo with Etv2 polyclonal serum and alexa-568 secondary at 24 hpf. Faint Etv2 expression can be observed in many EGFP-positive cells within the caudal vein plexus, while strong Etv2 expression is apparent in a separate EGFP-negative population of cells (indicated by a white bracket). Etv2 expression is not detectable in the caudal aorta at this time point (red arrows). (D) Two photon micrographs of Tg(fli1a:negfp)y7 embryos immunostained with Etv2 (left panels) or Fli1b (right panels) polyclonal serum. Top panels are signal from Alexa-568 secondary antibody. Bottom panels are overlay of Alexa-568 and EGFP fluorescence. Images are higher magnification views of embryos shown in Fig. 1 G and I. Left, arrows indicate EGFP-positive endothelial nuclei that do not express Etv2; arrowheads indicate EGFP-negative/Etv2-positive cells within the dorsal aorta. Right, arrows indicate EGFP-positive endothelial nuclei that also express Fli1b; arrowheads denote EGFP-negative/Fli1b-positive blood cells circulating within the dorsal aorta. (E) Flat mounted embryos at 5 ss immunostained with Etv2 polyclonal serum. Embryos were injected with Etv2 cMO and left in the dark (no UV exposure) or illuminated at approximately 2 ss with UV and allowed to develop for 1.5 h (1.5 h post UV) prior to fixation and immunostaining. |
Reprinted from Developmental Biology, 384(1), Moore, J.C., Sheppard, S., Shestopalov, I.A., Chen, J.K., and Lawson, N., Post-transcriptional mechanisms contribute to Etv2 repression during vascular development, 128-40, Copyright (2013) with permission from Elsevier. Full text @ Dev. Biol.