
Fig. 8
- ID
- ZDB-FIG-130905-12
- Publication
- Mandal et al., 2013 - Transgenic retinoic acid sensor lines in zebrafish indicate regions of available embryonic retinoic acid
- Other Figures
- All Figure Page
- Back to All Figure Page
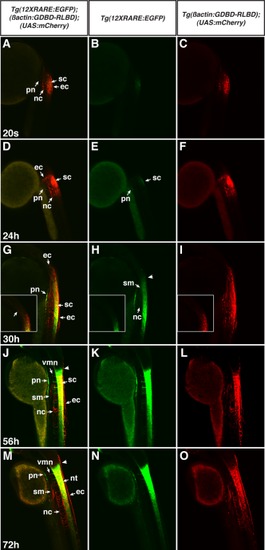
Direct comparison of the 12XRARE:EGFP and β-actin:GDBD-RLBD;UAS:mCherry transgenes. A–F: At the 20s stage and 24 hpf, the RA sensor is expressed in the skin epithelial cells (ec), the spinal cord (sc), the pronephros (pn) and the notochord (nc), while the 12XRARE:EGFP transgene is less strongly visible in the spinal cord and pronephros. G–I: By 30 hpf, mCherry expression from the β-actin:GDBD-RLBD;UAS:mCherry reporter has expanded in the anterior-posterior axis, but the tissue types expressing the reporter have not changed. MCherry can be seen in axons projecting anteriorly from the spinal cord (G). Insets in G–I are parallel confocal slices to the images in G–I, but focus on the anterior border of expression from the reporters. 12XRARE:EGFP reporter expression has also expanded in the A–P axis and the intensity of the reporter has increased. Low levels of expression are also in the somites (sm), though this is more obvious from mCherry. J–L: By 56 hpf, expression of both reporters has expanded more posteriorly, while the anterior border of expression at the hindbrain–spinal cord boundary has become more distinct. Expression is also seen in the axonal projects from the ventral motor neurons (vmn). M–O: Expression in these same tissues is maintained past 72 hpf. The ventral motor neurons can be seen elaborating further. All images are single confocal slices. Embryos are lateral views with anterior up. |