
FIGURE
Fig. SE
Fig. SE
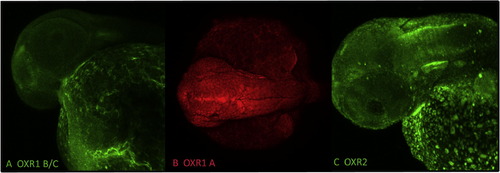
DISH expression patterns of OXR1A and OXR1B/C in 48 hpf zebrafish embryos. The images are maximum intensity projections from dual channel confocal z-series showing OXR1B/C and OXR1A expression patterns. (A, green) OXR1 B/C with fluorescein detection, (B, red) OXR1A with Cy3 detection, (C, yellow) merged channels for a comparison. Embryos are orientated with the anterior to the top and shown in dorsal view. |
Expression Data
Expression Detail
Antibody Labeling
Phenotype Data
Phenotype Detail
Acknowledgments
This image is the copyrighted work of the attributed author or publisher, and
ZFIN has permission only to display this image to its users.
Additional permissions should be obtained from the applicable author or publisher of the image.
Reprinted from Gene expression patterns : GEP, 13(7), Laroche, F.J., Tulotta, C., Lamers, G.E., Meijer, A.H., Yang, P., Verbeek, F.J., Blaise, M., Stougaard, J., and Spaink, H.P., The embryonic expression patterns of zebrafish genes encoding LysM-domains, 212-24, Copyright (2013) with permission from Elsevier. Full text @ Gene Expr. Patterns