
Fig. 8
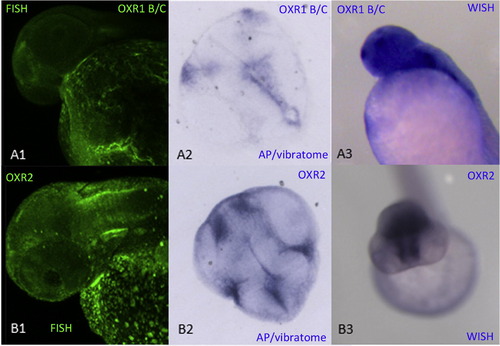
OXR1 and OXR2 expression in 48 hpf zebrafish embryo brain. The WISH and FISH expression pattern are compared with representative brain micro-sections. (A1) Maximum intensity projection from fluorescein confocal z-series of OXR1 B/C. (A2) OXR1 B/C transversal 6 μm thick section (A3) OXR1 B/C WISH (B1) maximum intensity projection of OXR2 fluorescein confocal z-series (B2) OXR2 transversal 6 7mu;m thick section, (A3) OXR2 WISH for a comparison. The embryos (A1, B1, A3) are orientated with anterior to the left and shown in side view. Embryo (B3) is orientated with the anterior to the back and shown in frontal view. |
| Genes: | |
|---|---|
| Fish: | |
| Anatomical Terms: | |
| Stage: | Long-pec |
Reprinted from Gene expression patterns : GEP, 13(7), Laroche, F.J., Tulotta, C., Lamers, G.E., Meijer, A.H., Yang, P., Verbeek, F.J., Blaise, M., Stougaard, J., and Spaink, H.P., The embryonic expression patterns of zebrafish genes encoding LysM-domains, 212-24, Copyright (2013) with permission from Elsevier. Full text @ Gene Expr. Patterns