
Fig. 2
- ID
- ZDB-FIG-130619-1
- Publication
- Ikeda et al., 2013 - Intrinsic properties of larval zebrafish neurons in ethanol
- Other Figures
- All Figure Page
- Back to All Figure Page
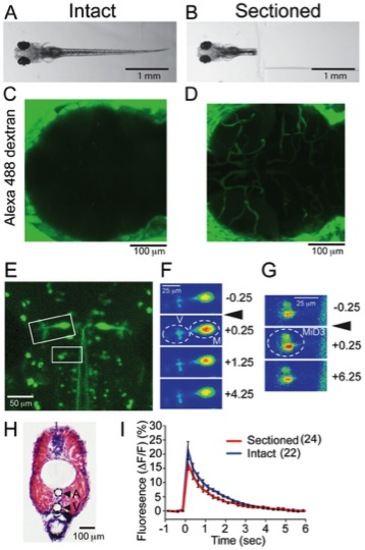
Sectioned larvae compared to intact larvae (A, B). Intact (A) and sectioned larva (B) were immersed in Alexa 488 dextran solution for 30 min. (C, D) Fluorescence images obtained from the cranial region after incubation. In the sectioned preparation, fluorescent dye stained the vasculature. (E–G) Calcium imaging of reticulospinal neurons. Reticulospinal neurons labeled with dextran-conjugated calcium green (E). Intensities of calcium green signal in boxed areas are shown in F and G as pseudocolors. Mauthner neurons (M), vestibulospinal neurons (V) and MiD3 neurons (MiD3) displayed increase of [Ca2+]i after the sound/vibration stimuli (arrowheads). Signals were measured in areas encircled by dashed lines before (0.25 sec) and after the stimuli (+0.25, +1.25, +4.25, +6.25 sec). (H) Image of HE stained larva trunk at the 9th body segment level. A and V designate artery and vein, respectively. (I) Plots of the fluorescence intensity change in the Mauthner neurons with sound/vibration stimuli. Traces from intact (blue) and sectioned larvae (red) are shown. Six Mauthner cells were measured in each condition. Stimuli were applied and calcium transients were measured at each concentration 2–5 times. The numbers of samplings are shown in parentheses. |