
Fig. 3
- ID
- ZDB-FIG-130618-31
- Publication
- Hashiguchi et al., 2013 - Anteroposterior and dorsoventral patterning are coordinated by an identical patterning clock
- Other Figures
- All Figure Page
- Back to All Figure Page
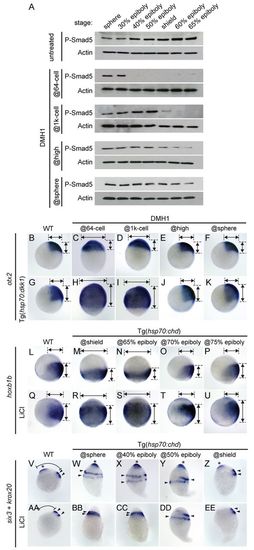
Temporal effectiveness of DMH1 in inhibiting P-Smad1/5, and the temporal patterning dynamics of DV tissues are unchanged when posteriorized or anteriorized by altered Wnt signaling. (A) P-Smad5 western blot for embryos collected at the indicated stages after treatment with the BMP signaling inhibitor DMH1 at the 64-cell, 1000-cell, high and sphere stages. Actin is a loading control. (B-K) Expression of otx2 in untreated wild type (B) and in wild type treated with DMH1 at the indicated stages (C-F). otx2 expression in HS Tg(hsp70:dkk1) embryos without (G) and with DMH1 treatment at the indicated stages (H-K). (L-U) Expression of hoxb1b in Tg(hsp70:chd) embryos not subject to HS (WT) (L,Q) and subject to HS at the indicated stages (M-P,R-U), without (L-P) and with (Q-U) LiCl treatment to activate Wnt signaling and posteriorize the embryos. (V-EE) Expression of six3 (asterisk) and krox20 (arrowheads) in wild type (V,AA) and in Tg(hsp70:chd) embryos subject to HS at the indicated stages (W-Z,BB-EE), without (V-Z) and with (AA-EE) LiCl treatment. The distance from the anterior tip of the head to the anterior boundary of r3 is indicated (V,AA). LiCl treatment was at shield stage. HS of Tg(hsp70:dkk1) embryos was performed at 37°C for 1 hour from 50% epiboly stage (5.3 hpf) to shield stage (6 hpf). Lateral views, dorsal to right. Embryos are shown at (B-K) 80% epiboly, (L-U) 90% epiboly and (V-EE) 6-somite stage. B, n=10/10; C, n=18/19; D, n=17/18; E, n=16/16; F, n=16/16; G, n=16/21; H, n=17/23; I, n=16/22; J, n=18/20; K, n=17/21; L, n=18/18; M, n=16/19; N, n=16/18; O, n=18/19; P, n=16/17; Q, n=9/13; R, n=10/15; S, n=16/18; T, n=18/20; U, n=17/19; V, n=23/23; W, n=18/19; X, n=16/18; Y, n=13/16; Z, n=19/19; AA, n=14/14; BB, n=14/14; CC, n=16/17; DD, n=16/18; EE, n=17/18. |