
Fig. 1
- ID
- ZDB-FIG-130210-3
- Publication
- Taylor et al., 2013 - P38 and JNK have opposing effects on persistence of in vivo leukocyte migration in zebrafish
- Other Figures
- All Figure Page
- Back to All Figure Page
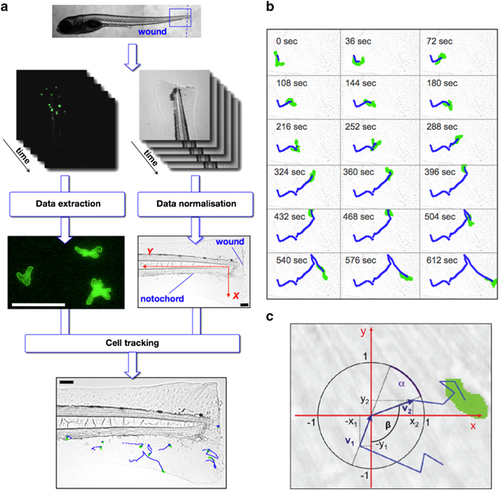
The automated leukocyte tracking system enables statistical analysis. pu.1:EGFP zebrafish embryos were injured via tail transection (blue dashed line). The blue-framed region was captured using time-lapse fluorescent microscopy resulting in image sequences with green fluorescent pu.1:EGFP-positive cells. Each cell was detected automatically using edge detection and was described as an object with the coordinates of its centre. In addition, bright field images were generated to normalize the data. In all generated movies the zebrafish was injured via tail transection, therefore the injury is located orthogonal to the notochord. To allow the analysis of data that are extracted from different movies it was necessary to normalize them. The image resolution was constant in all movies. Linear transformation of the trajectory data results into the new axes shown in red. The normalized data were used to track the cells over time resulting in cell trajectories (blue lines). Scale bars are 100 μm (a). Time-lapse bright field images overlaid with images of single pu.1:EGFP-positive cell automatically detected (green cell) and tracked (blue trajectory line) produced by automated single-cell tracking system in a pu.1:EGFP+ transgenic zebrafish embryo injured by tail transection at 5 days post fertilization (dpf) injured by tail transection. Time starts from 3-h post injury (h.p.w.) and the images shown are at 36 s intervals (original time gap between images used for data analysis was 18 s) (b). A trajectory (blue) of a pu.1:EGFP-positive cell (green) that was tested for random walk characteristics. Two motion vectors v1 and v2 (dark blue) with their projections onto the x axis and the y axis (x1, y1 and x2, y2) were used to test for isotropy, which is achieved by calculating the angle between v1 and v2. If the BM random walk model holds, the one-dimensional projections of the motion vectors onto the axes are Gaussian distributed (c). |
| Gene: | |
|---|---|
| Fish: | |
| Condition: | |
| Anatomical Term: | |
| Stage: | Day 5 |