
Fig. 2
- ID
- ZDB-FIG-130118-11
- Publication
- Freitas et al., 2012 - Hoxd13 contribution to the evolution of vertebrate appendages
- Other Figures
- All Figure Page
- Back to All Figure Page
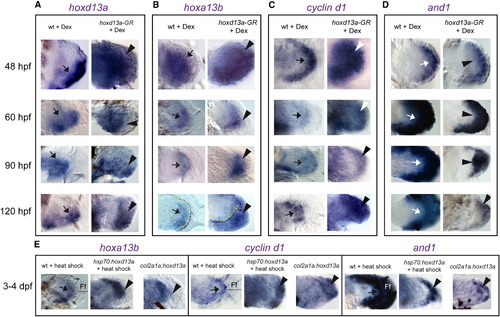
Gene Expression Dynamics after hoxd13a Overexpression in Zebrafish Fins Each panel shows expression dynamics of a gene from 48 to 120 hpf, in which wild-type controls (WT + Dex) and Dex-treated hoxd13a-GR injected fins are on left or right columns, respectively. Stages of development are indicated in each row at left side of the figure. Arrows point to the WT expression and arrowheads indicate expression induced by hoxd13a-GR injections.(A–C) hoxd13a (A), hoxa13b (B), and cyclin d1 (C) expression is located throughout most fin mesenchyme after injection (48 hpf). At 60 hpf, these genes show slightly higher levels in the injected fins. At 90 hpf, their expression domains start to be expanded distally. This expansion becomes very clear at 120 hpf.(D) No differences of and1 expression are observed between injected and control fins at 48 hpf. However, between 60 and 120 hpf, injected fins present a progressive reduction of and1 expression in the finfold.(E) Gene expression changes caused by hoxd13a overexpression controlled by hsp70 and col2a1a promoters. Transgenic fins show distally expanded hoxa13b and cyclin d1 expression 3 to 4 dpf and reduced and1 expression (arrowheads) when compared with controls (arrows).See also Figure S2. |
Reprinted from Developmental Cell, 23(6), Freitas, R., Gómez-Marín, C., Wilson, J.M., Casares, F., and Gómez-Skarmeta, J.L., Hoxd13 contribution to the evolution of vertebrate appendages, 1219-1229, Copyright (2012) with permission from Elsevier. Full text @ Dev. Cell