
FIGURE
Fig. S1
Fig. S1
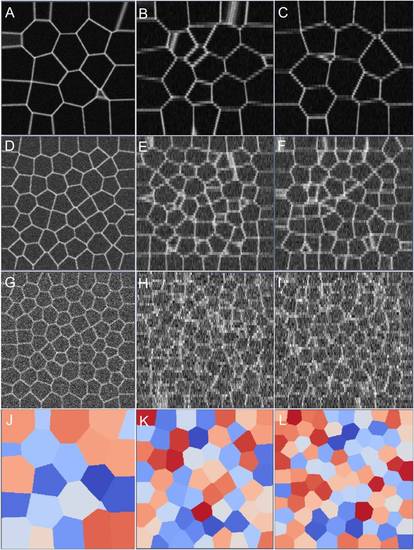
Tensor voting field determination. (A) 2D voting field parameters. (B) Heat map showing the stick voting field saliencies in 2D. The stick tensor is represented using line glyphs and overlaid on the figure. (C) A simple example showing two sampled intersecting circles and their reconstruction (D). |
Expression Data
Expression Detail
Antibody Labeling
Phenotype Data
Phenotype Detail
Acknowledgments
This image is the copyrighted work of the attributed author or publisher, and
ZFIN has permission only to display this image to its users.
Additional permissions should be obtained from the applicable author or publisher of the image.
Full text @ PLoS Comput. Biol.