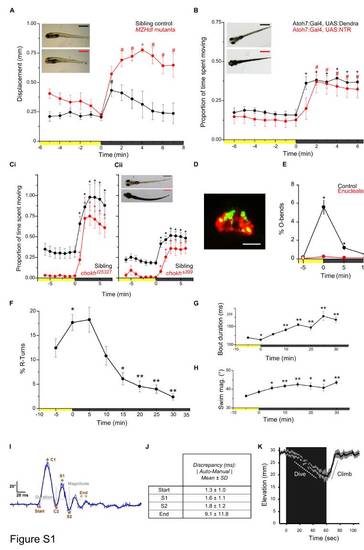
Characterization of VMR, Related to Figure 1
(A-C) The VMR persists in blind larvae. (A) Maternal zygotic headless mutants (MZHdl, 7 dpf) and (B) retinal ganglion cell ablated larvae Tg(Atoh7:Gal4)s1992t ; Tg(UAS-E1b:NfsBmCherry) (6-7 dpf) and (C) chokh mutants (5 dpf): (i) allele: t25327 and (ii) allele s399. Hdl: repeated measures ANOVA: F7, 21 = 4.26, p = 0.005. Sibling control: n = 3; Hdl: n = 4 groups of 20 larvae. Tg(Atoh7:Gal4)s1992t ; Tg(UAS-E1b:NfsB-mCherry: ANOVA: F12, 276 =14.893, p < 0.001. Control (Tg(Atoh7:Gal4)s1992t ; Tg(UAS:Dendra-Kras) [1]) (n = 24 larvae). Chokht25327: repeated measures ANOVA: F12,259 = 30.64, p < 0.001, n = 12 larvae. Sibling control n = 20 ; chokht25327 n = 20 larvae. Chokhs399 : repeated measures ANOVA: F12,129 = 15.50, p < 0.001. Sibling control: n = 16 larvae; chokh: n = 10 larvae. Timepoints show mean activity for the preceding minute (mean ± SEM). For pairwise comparisons to baseline time point -5 min. # p < 0.05, *p < 0.01. Inset in (A) shows MZHdl larvae and siblings and in (B) shows metronidazole treated Tg(Atoh7:Gal4)s1992t larvae with visual background adaptation phenotype after nitroreductase ablation of retinal ganglion cells (6 dpf), and (C) chokh mutant larvae prescreened for locomotor responsiveness prior to behavioral experiments and siblings (5dpf).
(D) Confocal z-projection showing a sagittal view of the pineal in Tg(tph2:NfsB-mCherry)y227 (2 dpf). Anti-mCherry (red) shows cell bodies of photoreceptor neurons at the pineal base and anti-RET-P1 (green) highlights photosensitive outer segments. Scale bar 25 μm.
(E) Kinematic analysis of VMR in control and enucleated larvae (7 dpf). Enucleated larvae do not perform O-bends in response to light extinction as is seen in control larvae (control: n = 18 groups of 10 fish ; enucleated: n = 28 groups of 10 fish). Statistical comparisons are to the baseline measurement at -5 min. Data represents the mean of observations during the first 16 s following each time point (mean ± SEM).
(F-H) Kinematic analysis of wild-type larvae during VMR and subsequent dark adaptation. Following light extinction, R-turn initiation frequency (F) peaks at approximately 5 min. (VMR) then declines to a low baseline (dark adaptation) (ANOVA; F3.2,28.3 = 24.37, p < 0.001). In contrast, both R-turn swim bout duration (G) and swim tail beat magnitude (H) continue to steadily increase over 30 min (bout duration: ANOVA; F1.9,13.3 = 13.27, p = 0.001); swim magnitude: ANOVA; F7,49 = 4.46, p = 0.001). Statistical comparisons are to the baseline measurement at -5 min. Data represents the mean (± SEM) of observations during the first 16 s following each time point. For pairwise comparisons to -5 min *p < 0.05, **p < 0.01 (n = 10 groups of 25 larvae).
(I and J) Validation of automated kinematic measurements (by Flote software) of larval R-turn swim bouts via comparison with manual observations.
(I) Trace shows body curvature of a single larvae during an R-turn (blue line = raw measurement, black line = smoothed data). Green diamonds show time points during the swim bout identified by manual inspection of the video. Red diamonds show the same points identified by software. C1 and C2 refer to the initial bend and counterbend (for consistency with terminology during startle responses) and S 1/2 refer to the first two tail bends during subsequent swimming. Swim bout duration is marked, and swim magnitude is the mean of the change in larval curvature from C1-S1 and S1-S2 (mean of two marked amplitudes). Tail beat frequency is calculated from the time taken for C2-S2, which represents a single complete tail movement.
(J) Comparison of automated and manually identified time points during swim bouts for 50 Rturns. The largest discrepancy is in identification of swim bout termination, which Flote underestimates by about 10 ms due to the presence of subtle tail undulations at the end of some R-turn swims. The mean swim bout duration for R-turns did not differ significantly between automatically and manually recorded observations (Flote: 120.3 ± 3.6 ms; Manual: 113.9 ± 4.3 ms ; F1,98 =1.28, p = 0.26).
(K) Vertical movement of control larvae (6-7 dpf) during VMR in a 30 mm deep column of water (E3). Larvae maintain position close to the water surface under lit conditions. After light extinction, larvae dive downward. Mean vertical position of larvae in groups of 10 per trial was recorded every second (shaded line represents ± SEM)(n = 5 groups of 5 larvae).
|
